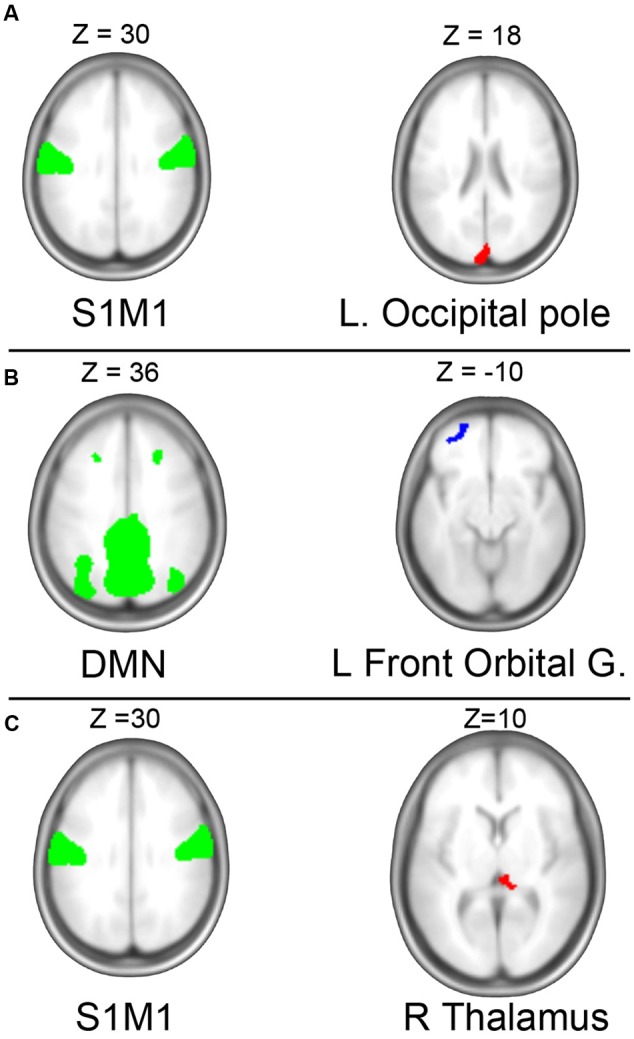
FIGURE 3.

Independent component analysis (ICA). (A) ICA revealed a negative association between baseline measures of aerobic capacity and connectivity between the sensorimotor network (left) the occipital pole (right). (B) Longitudinal gain in aerobic capacity was associated with increased connectivity between default mode network (DMN) and left prefrontal cortex. (C) Change in VO2-peak was negatively related to change in connectivity of the somatosensory network (S1M1) to right thalamus. Green regions illustrate the independent components (IC) at baseline; red indicates areas experiencing decreased connectivity to the IC with higher (or gain in) VO2-peak; blue indicates areas with increased fitness predicted connectivity.
