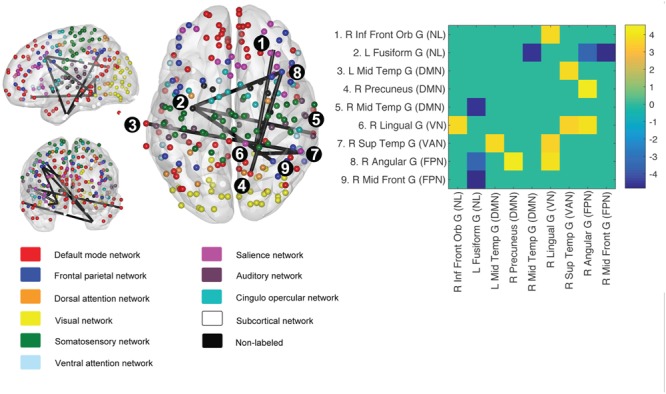
FIGURE 4.

Network based statistics (NBS) derived graph component predicted by change in VO2-peak. Using change in VO2-peak to predict longitudinal change in the brain graph (264 nodes), we retrieved a subgraph spanning both task-negative and task-positive networks. Edge definition was p = 0.001 unc, and network component significance threshold FWE corrected p < 0.05. The adjacency matrix (top right) depicts participating nodes, and only significant t-values (t > 3.54) are shown. For MNI-coordinates of participating nodes, see Supplementary Table S1.
