
FIGURE 6.
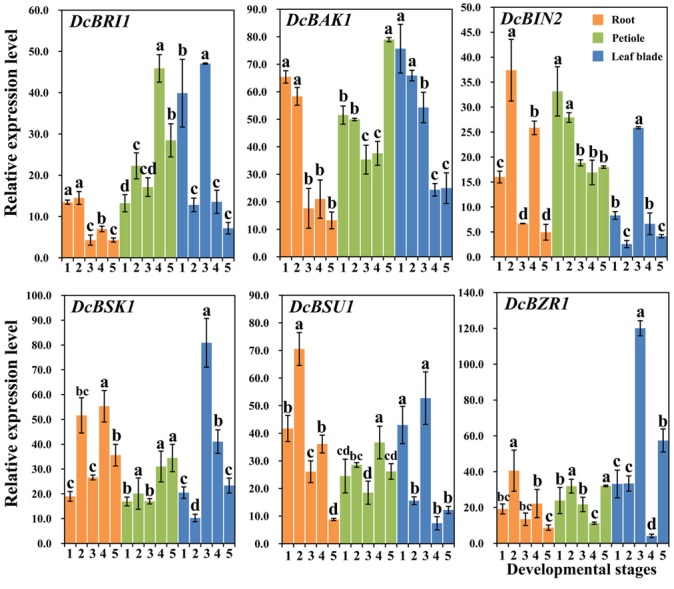
Expression profiles of genes involved in the BR signaling pathway at different stages and in different organs. Error bars represent standard deviation (SD). Columns with the same letter are not significantly different (P < 0.05).
Official websites use .gov
A
.gov website belongs to an official
government organization in the United States.
Secure .gov websites use HTTPS
A lock (
) or https:// means you've safely
connected to the .gov website. Share sensitive
information only on official, secure websites.
Expression profiles of genes involved in the BR signaling pathway at different stages and in different organs. Error bars represent standard deviation (SD). Columns with the same letter are not significantly different (P < 0.05).