
FIGURE 8.
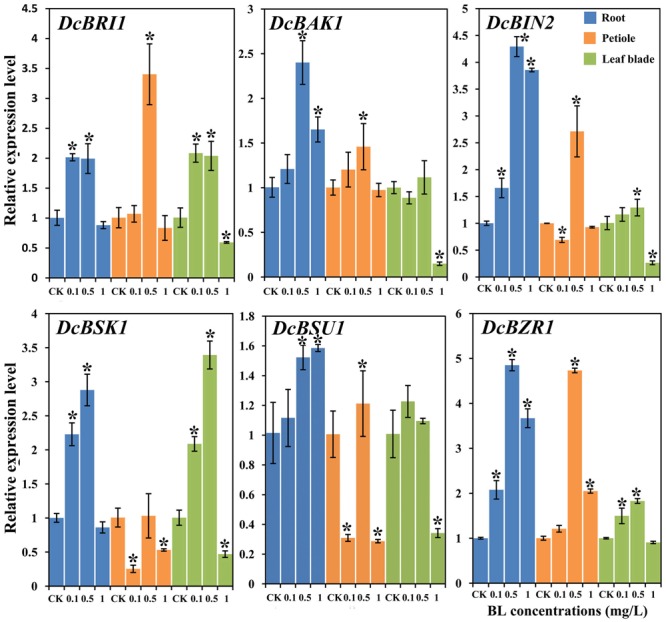
Expression profiles of genes involved in the BR signaling pathway under different BL concentrations (0, 0.1, 0.5, and 1 mg/L) and in different organs. Error bars represent standard deviation (SD). Student’s t-test was used to identify the differences under different concentration treatments (P < 0.05; ∗, control versus treatment).