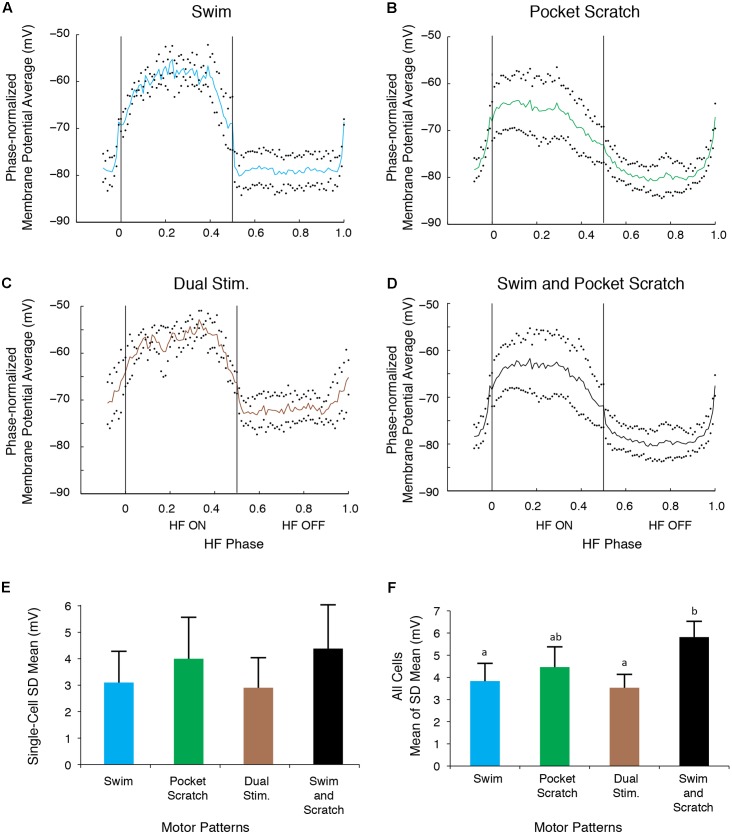
FIGURE 8.
The motoneuron membrane potential oscillations during swim/pocket scratch dual stimulation were as regular as those during swim stimulation alone or pocket scratch stimulation alone. (A–C) Dual-referent phase-normalized membrane potential average and the SD (black dots) across all cycles of the cell in Figure 6 with the same stimulation parameters during swim stimulation (A, blue curve), pocket scratch stimulation (B, green curve), and swim/pocket scratch dual stimulation (C, brown curve). (D) Dual-referent phase-normalized membrane potential average of the pooled set of all swim stimulation-alone cycles (from A) and all pocket scratch stimulation-alone cycles (from B) for this cell. (E) The mean of the SD within each stimulation paradigm. Error bars, SD. (F) The mean of the mean SD in (E) across all 13 cells with the same stimulation paradigm. Error bars, SE. a, b, indicate significant differences by Friedman’s test followed by Dunn’s test (Friedman’s test: p = 0.017; Dunn’s test: swim stimulation vs. pooled, p = 0.031; dual stimulation vs. pooled, p = 0.031; other pairs were not significantly different).

