
FIGURE 7.
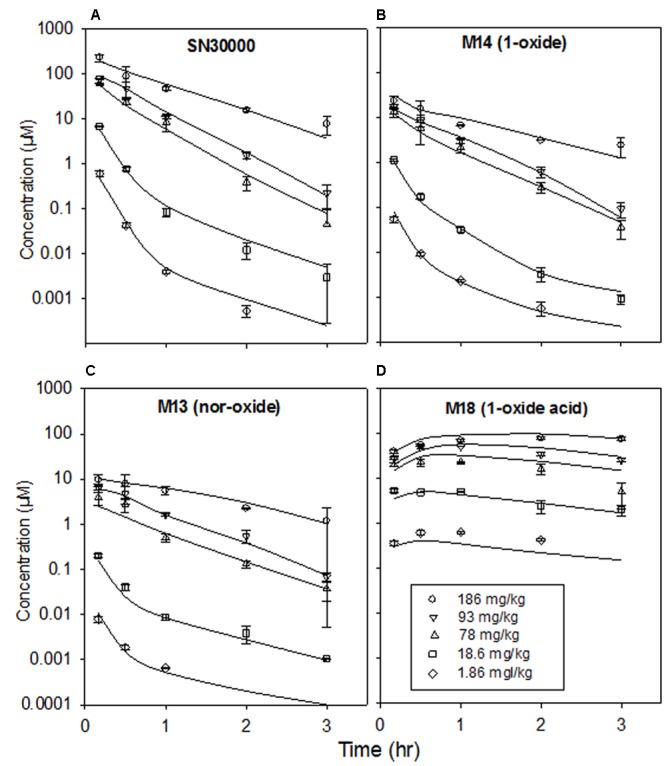
Plasma concentrations of SN30000 and its major metabolites after i.p. administration of SN30000 at the indicated doses to female NIH-III mice. Each point is the mean and SEM for three animals. Lines are fitted using the compartmental PK model described in the text, with clearance parameters dependent on the body temperature changes shown in Figure 4.