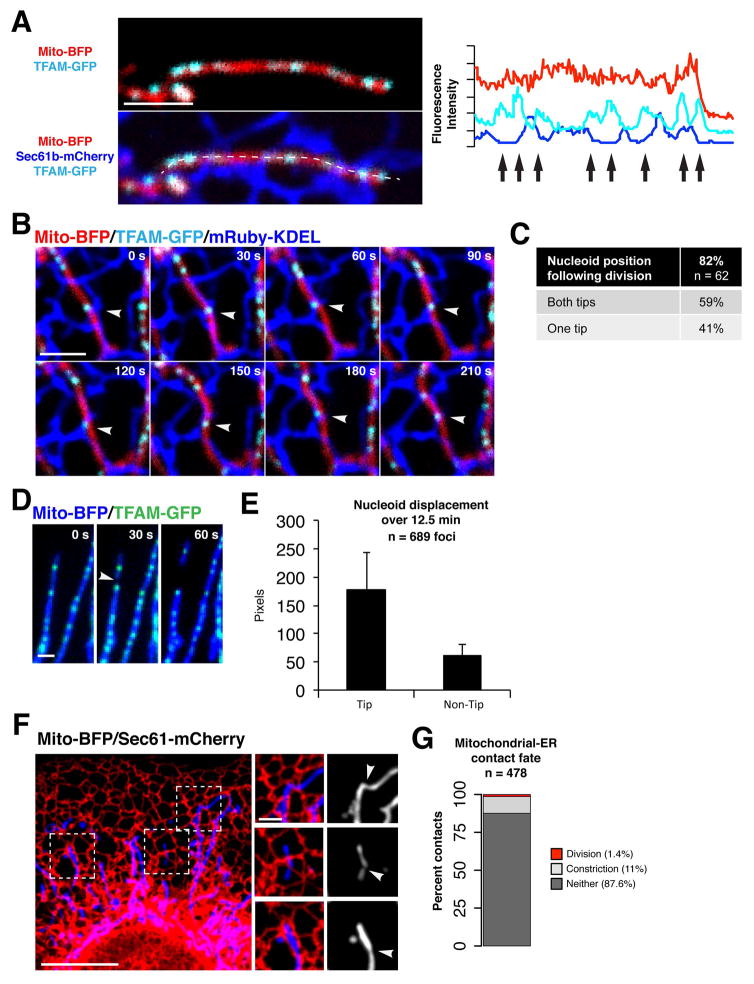
Figure 1. Mitochondrial DNA nucleoids are spatially linked to mitochondria-ER contacts in human cells.
(A) Left panels show a merged image of a live U2OS cell expressing mito-BFP, TFAM-GFP and Sec61b-mCherry (ER). Right panel shows the pixel intensity of mito-BFP, TFAM-GFP and Sec61b-mCherry from a line scan drawn along the mitochondrial tubule (dotted line), arrows indicate nucleoid positions. (B) Time-lapse images of a U2OS cell expressing mito-BFP, TFAM-GFP and mRuby-KDEL (ER), a single plane is shown. Arrow indicates a site of persistent co-localization between a TFAM-GFP labeled nucleoid and an ER-mitochondria contact. (C) Number of mitochondrial divisions in U2OS cells spatially linked to TFAM-GFP labeled nucleoids, from 43 cells. (D) Time-lapse images of mitochondrial division (marked by arrow) spatially linked to a TFAM-labeled nucleoid focus in a U2OS cell. (E) Graph indicating the displacement of picogreen-labeled nucleoids in live Cos7 cells over 12.5 minutes as a function of their intra-mitochondrial position. Data are mean +/− SD. (F) Merged image of a live U2OS cell expressing mito-BFP and Sec61b-mCherry (ER). Right panels show examples of mitochondrial constrictions co-localized with ER tubules. (G) Graph indicating the percentage of persistent mitochondrial-ER co-localizations that become sites of mitochondrial constriction or division over 5 minutes in live U2OS cells. Scale bars: (A, B, D, F inset) 2 um; (F) 10 um.

