
Figure 2.
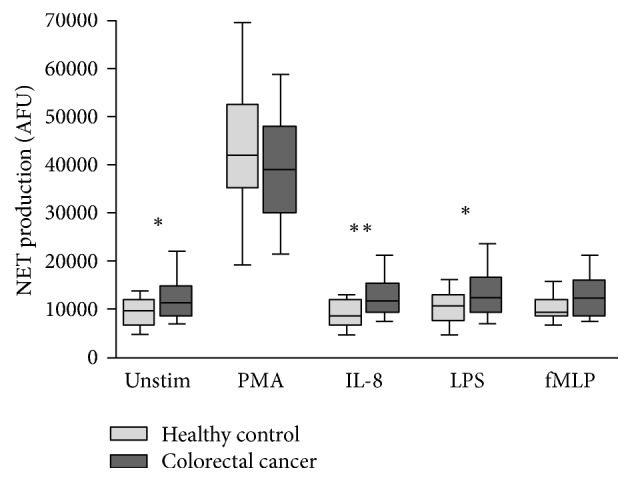
Box-and-Whisker plot (10th–90th percentile) of NET production in healthy control subjects (n = 20) and patients with colorectal cancer (n = 45) in response to no stimulant (Unstim), PMA, IL-8, LPS, and fMLP. Statistical significance, measured by Mann–Whitney U test, is denoted by ∗p < 0.05 and ∗∗p < 0.01.