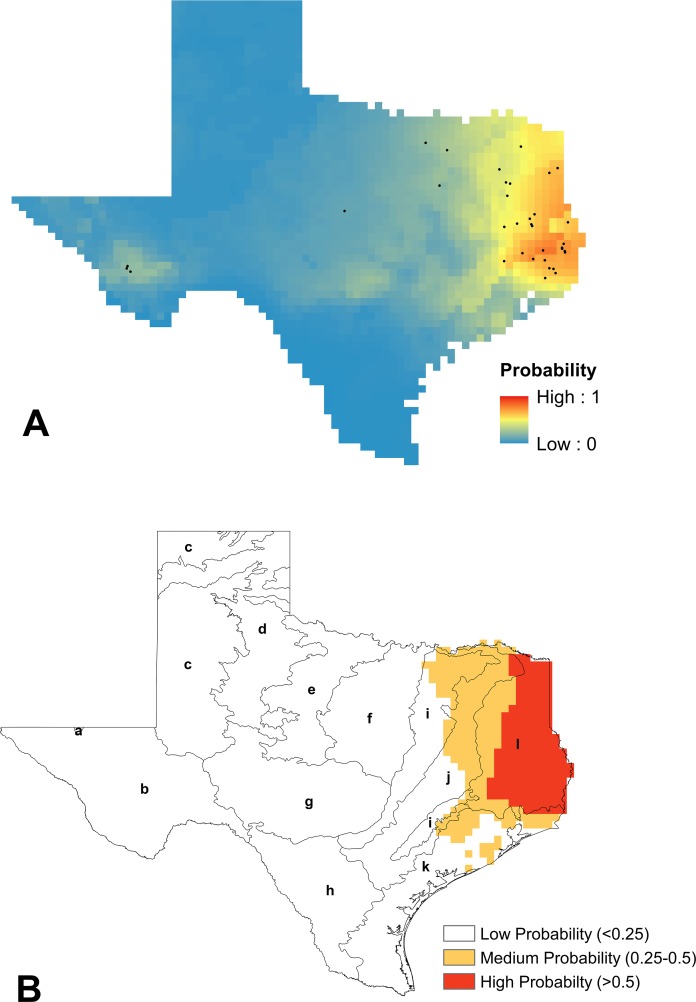
Figure 5. Modeling results for B. impatiens.
(A) Mean logistic output from MaxEnt, averaged over 100 replicates, showing probability of suitable habitat being present for B. impatiens (average training AUC over 100 runs = 0.931 ± 0.015 and average test AUC 0.9 ± 0.05). Unfiltered species presence data points are represented as black dots. (B) Reclassified SDM for B. impatiens in Texas shown with EPA Level III ecoregions outlined (a, Arizona/New Mexico Mountains; b, Chihuahuan Deserts; c, High Plains; d, Southwestern Tablelands; e, Central Great Plains; f, Cross Timbers; g, Edwards Plateau; h, Southern Texas Plains; i, Texas Blackland Prairies; j, East Central Texas Plains; k, Western Gulf Coastal Plain; l, South Central Texas Plains). The highest probabilities of suitable habitat modeled for B. impatiens in Texas are in the eastern portion of the state, especially in the South Central Plains ecoregion.

