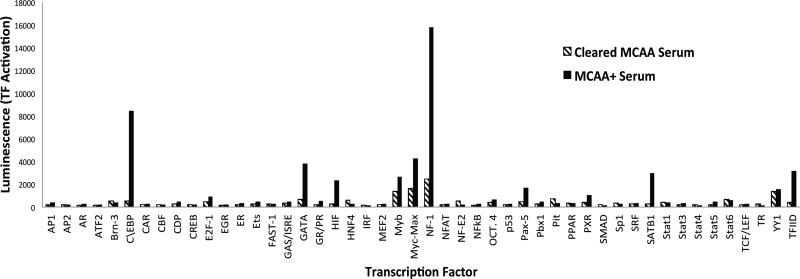
Figure 2.
Transcription factor (TF) profile showing difference in amount of active transcription factor based on treatment. A nuclear extraction was performed and assessed for relative levels of activation by detection of presence of TF in the nucleus. Luminescence was detected when TF-bound sequences hybridized with complimentary sequences on the plate. Hatched bars indicate treatment of human mesothelial cells with pooled MCAA+ serum cleared of IgG. Black bars indicate treatment of human mesothelial cells with pooled MCAA+ serum.

