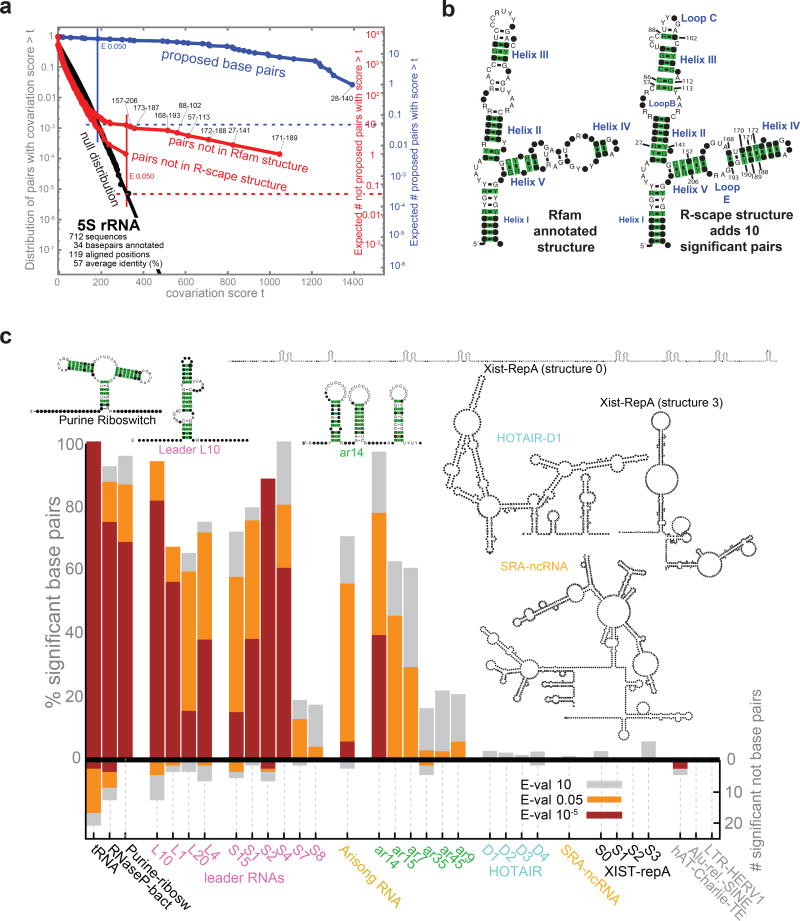
Figure 2. Covariation analysis of known or proposed RNA secondary structures.
(a) 5S rRNA as an example of an known structural RNA with significant covariation support. The plot (left) shows the expected null distribution (fit: black lines; data: black circles), compared to covariances observed for pairs in (blue) or not in (red) the annotated structure. (b) Covariation support for the Rfam annotated 5S rRNA structure, versus an alternative structure proposed by R-scape to include all significantly covarying pairs. Significant pairs (at E< 0.05) are highlighted in green. Coordinates are alignment column positions. Specific nucleotides are shown when their weighted frequency in the column exceeds 50%; black dots represent more variable positions. (c) On the positive y-axis, plot shows percentage of base pairs supported by covariation at three thresholds (red, E< 10–5; orange, E < 0.05; grey, E < 10). Negative y-axis shows the number of additional significantly covarying pairs not in the proposed structure. Transfer RNA (tRNA), RNase P RNA, and the purine riboswitch (leftmost) are examples of functional structural RNAs with strong statistical support; three human DNA repeat elements (rightmost) are negative controls with no known RNA secondary structure constraint.

