
Figure 1.
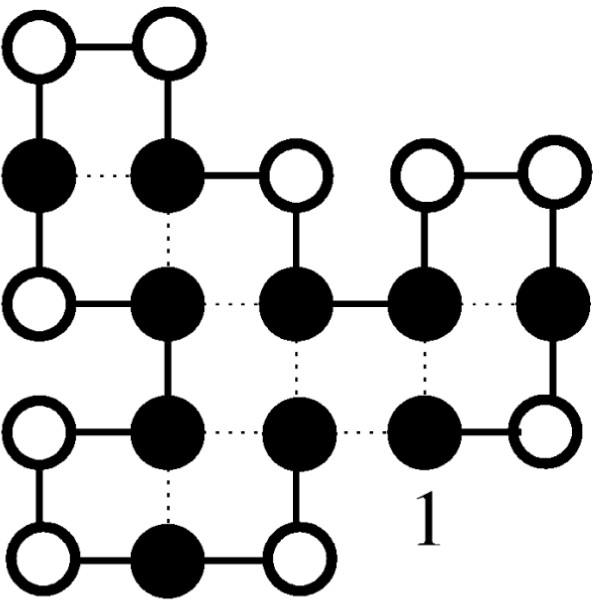
A sample protein conformation in the 2D HP model. The underlying protein sequence (Sequence S1-1 from Table 1)is HPHPPHHPHPPHPHHPPHPH; black circles represent hydrophobic amino acids, while white circles symbolise polar amino acids. The dotted lines represents the H-H contacts underlying the energy calculation. The energy of this conformation is -9, which is optimal for the given sequence.