
Figure 12.
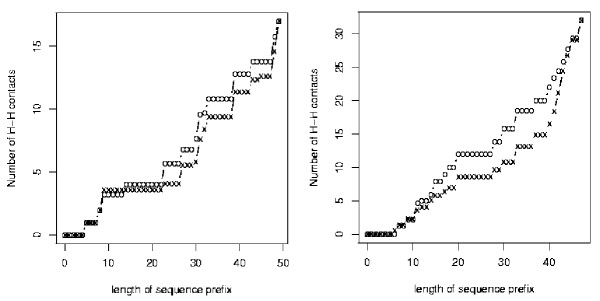
Plot of mean number of H-H contacts, ACO-HPPFP-3 vs PERM in 2D and 3D. Mean number of H-H contacts as a function of prefix length for a biological sequence (B50-4, 50 amino acids) in 2D (left side) and Sequence S2-6 from Table 1 (48 amino acids) in 3D. Crosses and circles represent mean values for an ensemble of 100 native structures found by ACO-HPPFP-3 and PERM, respectively.