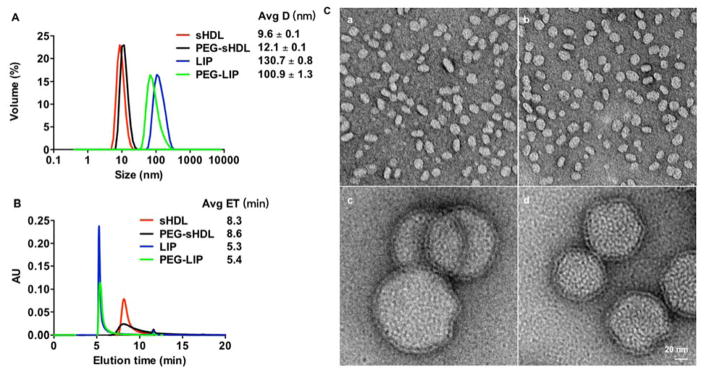
Figure 1.
Size distributions of the different nanoparticles as determined by dynamic light scattering (A), gel permeation chromatography (B), and transmission electron microscopy images of nanoparticles at 100,000-fold magnification (C). Scale bar = 20 nm. Nanoparticle sizes were reported as mean ± SD (n = 3).

