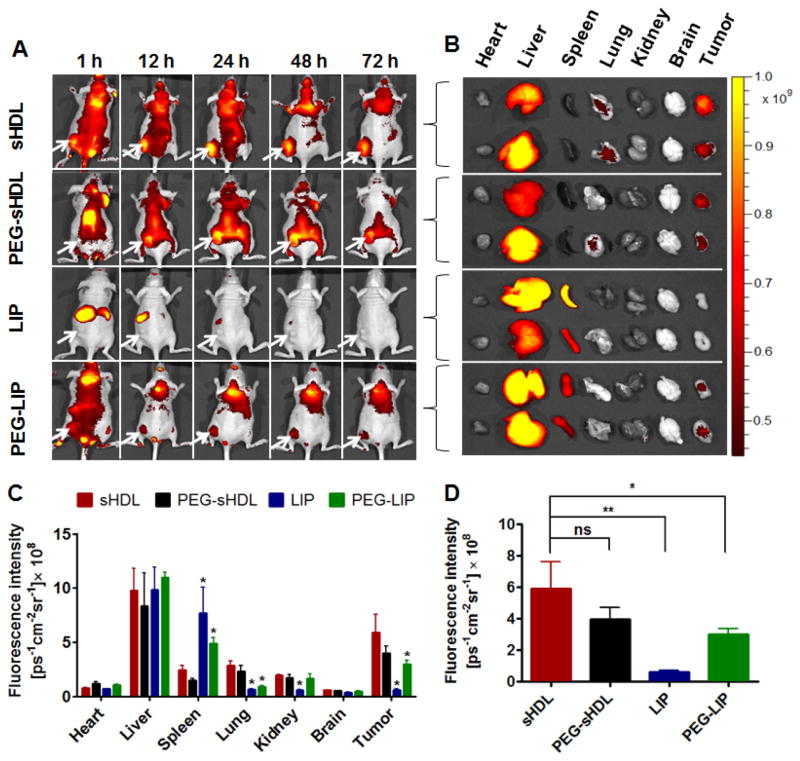
Figure 6.
The in vivo imaging of HCT 116 tumor-bearing nude mice after administration of nanoparticles at 1 h, 12 h, 24 h, 48 h and 72 h. Tumors were located in the left flanks as indicated by the arrows (A). The ex vivo fluorescence images of isolated organs collected at 72 h post-injection (B). The average fluorescence intensities of tissues (C) and tumors (D) were analyzed using Living image® software. Data represent mean ± SD (n=3). *: P<0.05, **: P<0.01 relative to sHDL group.

