
Figure 2.
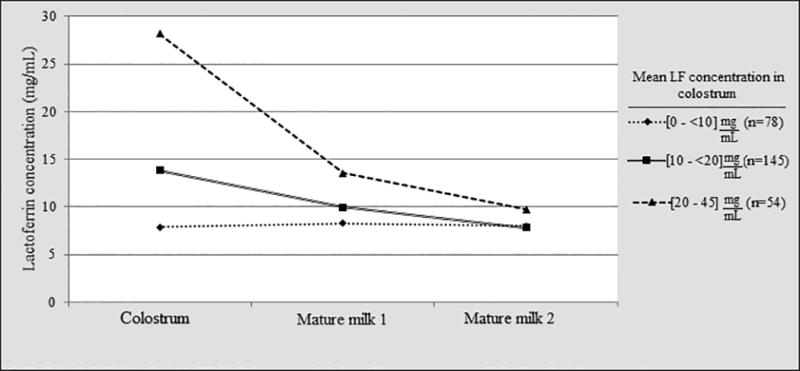
Variation in LF concentration in breast milk from each individual mother over the course of lactation. Data are presented as mean LF concentrations, and are classified in three groups per initial LF concentration in colostrum. Mothers with colostrum LF concentrations between 20 and 45 mg/mL (▲) maintained relative higher concentrations at 1 month, when compared to mothers with lower colostrum LF concentrations [10 to < 20 mg/mL (■) and 0 to < 10 mg/mL (◆)]. At two months, all mothers had similar LF concentration values.