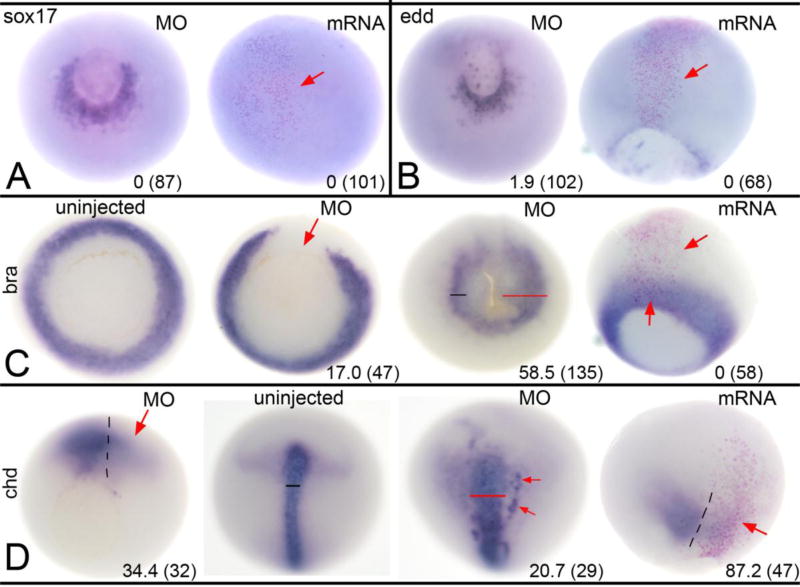
Figure 4. Altered Wbp2nl levels affect mesoderm but not endoderm.
(A) At gastrula stages, sox17 expression surrounding the ventral blastopore on the MO-injected side of an embryo (left image, vegetal view) is not discernably different from control side. Increased Wbp2nl in the animal pole ectoderm (right image, animal view; clone marked by pink nuclei and red arrow) does not ectopically induce sox17. (B) At gastrula stages, edd expression surrounding the ventral blastopore on the MO-injected side (left image, vegetal view) is not discernably different from control side. Increased Wbp2nl in the neural ectoderm (right image, dorsal view; clone marked by pink nuclei and red arrow) does not ectopically induce edd. (C) At gastrula stages, mesoderm expression of bra encircles the blastopore in uninjected control embryos (left image, vegetal view); knockdown of Wbp2nl causes a loss of bra expression (left middle image, vegetal view, red arrow). In contrast, at neural plate stages (right middle image, vegetal view), we detect a posterior expansion (red bar) of bra expression on the knock-down side. At gastrula stages, increased Wbp2nl (right image, dorsal view; clone marked by pink nuclei between red arrows) does not alter endogenous bra expression nor ectopically induce it. (D) At gastrula stages, mesoderm expression of chd is reduced by Wbp2nl knock-down (red arrow, left image, vegetal view; dashed line indicates dorsal midline). In contrast, at neural plate stages, chd is expanded (compare uninjected control pattern [left middle image] to MO-injected pattern [right middle image]; dorsal views with anterior to the top). Red bar shows a wider domain and red arrows denote ectopic expression. At gastrula stages, increased Wbp2nl (right image, dorsal view, anterior to top; dashed line indicates dorsal midline) also reduces endogenous chd expression (red arrow). Frequencies of the phenotypes and sample sizes (n) are given in each panel.

