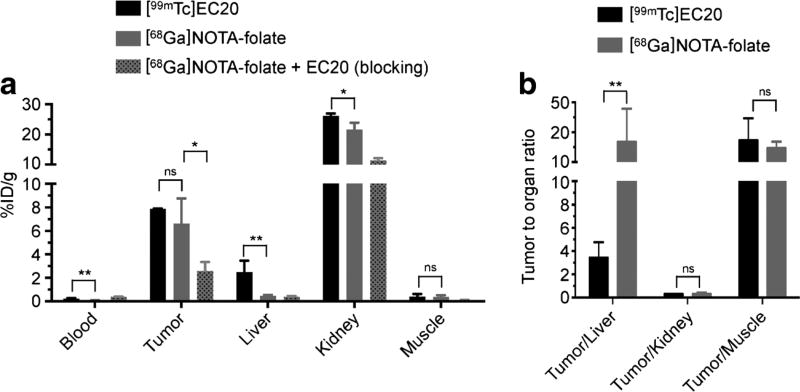
Fig. 4.
[68Ga]NOTA-folate biodistribution. a Biodistribution data (%ID/g ± SD) of KB tumor bearing nude mice (n = 3) after 4.5 h post injection of [99mTc]EC20 (501 ± 11 µCi, 18.5 ± 0.4 MBq, 3.1 nmol, 200 µl PBS containing 10 % ethanol); [68Ga]NOTA-folate (383 ± 53 µCi, 14.2 ± 2.0 MBq, 3.1 nmol, 200 µl PBS containing 10 % ethanol); or [68Ga]NOTA-folate (222 ± 25 µCi, 8.2 ± 0.9 MBq, 3.1 nmol, 200 µl PBS containing 10 % ethanol) co-injected with EC20 (12.5 nmol), along with b selected tumor to organ ratios. Full biodistribution data is available in the supplementary materials. P values were calculated with Student’s t tests, unpaired; *P < 0.05; **P < 0.01; ***P < 0.001; ****P < 0.0001.

