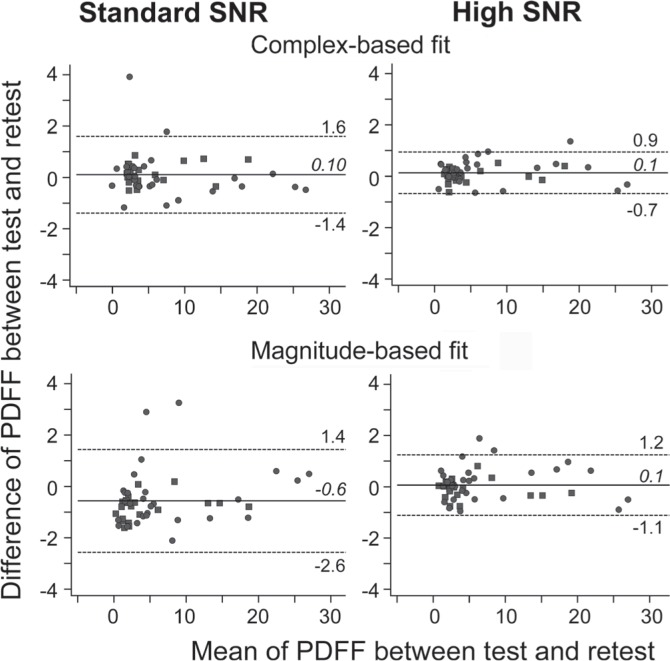
Fig 2.
Bland-Altman plots of in vivo fat quantification demonstrate improved test-retest repeatability using the high signal-to-noise ratio (SNR) protocol for both complex- and magnitude-based fitting. The numbers and horizontal lines show the mean (italic and solid line) and 95th percentile confidence intervals (1.96 × standard deviations (non-italic and dotted line) of Δ). PDFF, proton density fat fraction; Δ, the difference.

