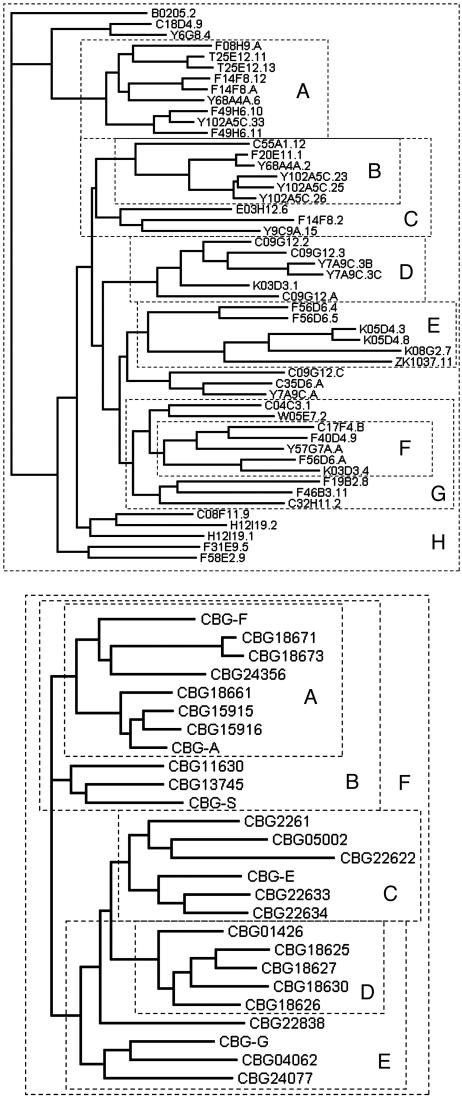
Fig. 3.
Groups analyzed for dN/dS ratio. Genes analyzed by codeml are indicated on a tree for each species. Each set is boxed by a dashed line, and the lettering identifies the results summarized in Table 2. In each species, a few proteins were excluded because they did not align robustly (or, in two cases, because they had not yet been found).

