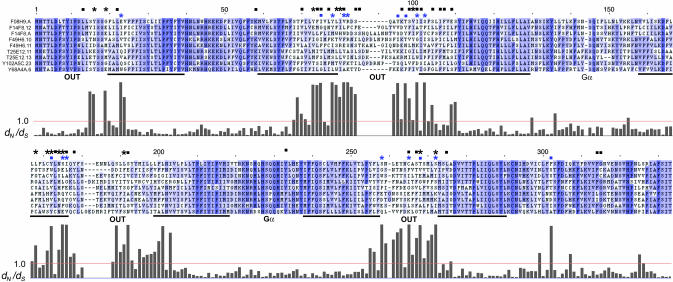
Fig. 4.
dN/dS ratios and SRZ protein structure. The results of dN/dS analysis from C. elegans on a multiple alignment of group A SRZ proteins (Fig. 3). Above the alignment, blue marks indicate results from group A: asterisks, dN/dS > 1.0 (P ≥ 0.99); squares, additional sites with P ≥ 0.95. Black asterisks and squares summarize the same values from the other seven C. elegans dN/dS analyses. Below the alignment is a histogram of the approximate posterior mean dN/dS for each ungapped column of this group A alignment, with a red reference line at dN/dS = 1.0. Nearly identical results were obtained from a similar analysis of the group A alignment by using a recent update of paml (version 3.14) that implements an empirical Bayes method for site identification (Z. Yang, personal communication). Black bars indicate positions of TM domains, and text indicates orientation with respect to the plasma membrane and regions of Gα binding, all by analogy with other GPCRs. Alignment shading indicates alignment quality, with darker blue signifying higher scores.

