Fig. 4.
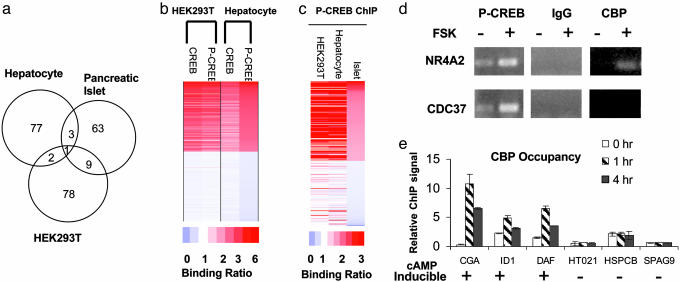
cAMP stimulates distinct profiles of CREB target genes in different tissues. (a) Venn diagram showing overlap between CREB target genes in human islets, hepatocytes, and HEK293T cells. (b) ChIP-chip assay of promoters occupied by CREB and P-CREB in human hepatocytes compared with HEK293T cells. Top 1,000 and bottom 1,000 scoring genes from hepatocyte P-CREB ChIP-chip assays were plotted. Relative binding ratio observed for each gene is color-coded. (c) Comparison of P-CREB binding profiles from ChIP-chip assays of HEK293T cells, human pancreatic islets, and human hepatocytes. Top 200 and bottom 200 scoring genes from islet P-CREB ChIP-chip assays were plotted. (d) ChIP assay of HEK293T cells showing effects of FSK on recruitment of CBP to cAMP inducible (NR4A2) vs. noninducible (CDC37) genes. Levels of P-CREB on each promoter are indicated. (e) Quantitative PCR assay showing relative levels of CBP over cAMP inducible and noninducible promoters after 0, 1, or4hofFSK treatment by ChIP.

