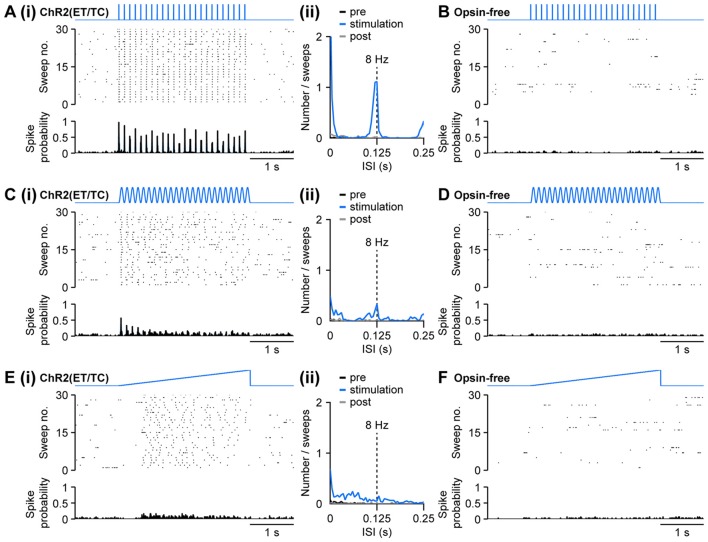
Figure 4.
Optogenetic activation of pyramidal neurons in the neonatal PFC by different patterns of light stimulation in vivo. (Ai) Representative raster plot and spike probability histogram displaying the firing of ChR2(ET/TC) transfected layer II/III pyramidal neurons in response to 30 sweeps of repetitive light pulses (473 nm, 3 ms, 14 mW/mm2) at 8 Hz recorded from a neonatal mouse after IUE at E15.5. (ii) Corresponding inter-spike interval (ISI) histogram averaged for 3 s before light stimulation (pre, black), 3 s during ramp stimulation (stimulation, blue), and 3 s after light stimulation (post, gray). (B) Same as (Ai) for an opsin-free control animal. (Ci,ii,D) Same as (Ai,ii,B) for sinusoidal light stimulation. (Ei,ii,F) Same as (Ai,ii,B) for ramp light stimulation.

