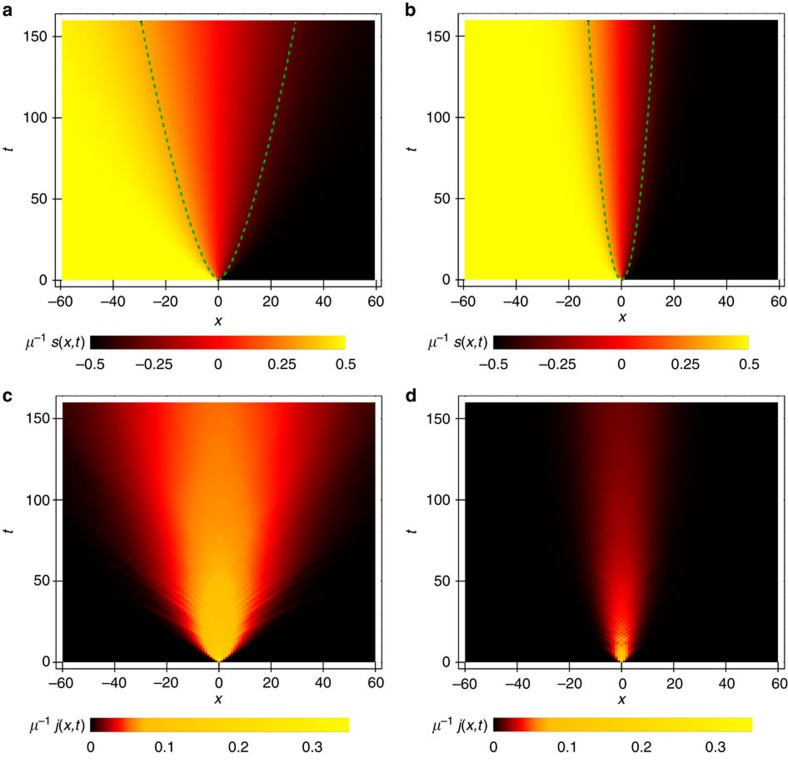
Figure 1. Dynamics of spin and current densities.
Time evolution of spin density  (a,b) and current (c,d) profile j(x, t)=tr(ρ(t)jx) for the isotropic point Δ=1 (a,c), and Δ=2 (b,d), following an inhomogeneous quench. One can see that the spreading is much faster for Δ=1, in both cases though it is slower than ballistic. Dashed green curves guide the eye towards scaling x∼t2/3 in a, and x∼t1/2 in (b). Data are shown for n=320 and small initial polarization μ=π/1,800.

