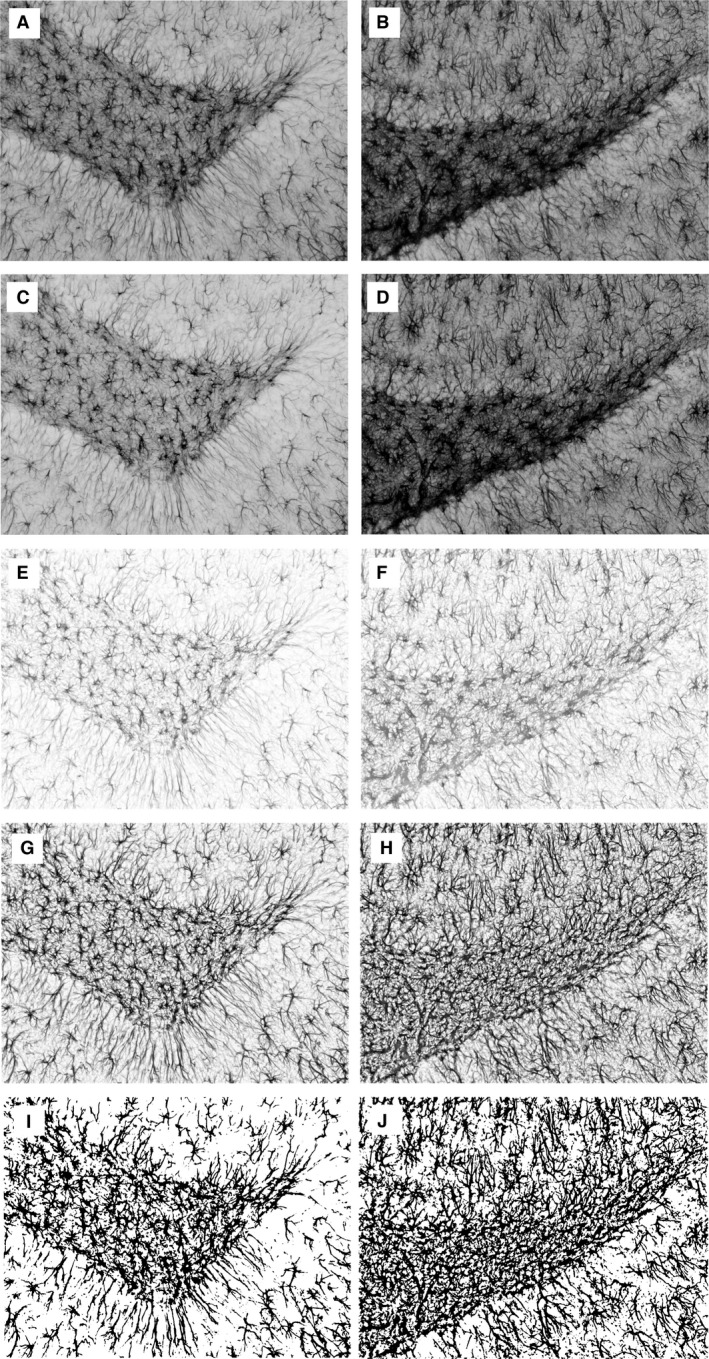
Figure 2.

Assessment of glial fibrillary acidic protein (GFAP)‐immunoreactive area fraction (GFAP+AF) illustrated on examples of two images taken from the dentate gyrus region of the rat treated on P6 with LPS alone (left column) and of the control one (right column). Initially, RGB images were taken with a digital camera (A, B). Then, an 8‐bit green channel was extracted (C, D) with subsequent background subtraction (E, F). After contrast enhancement (G, H), a thresholding method (Korzynska et al. 2013) was applied to obtain binary images (I, J). Finally, GFAP+AF was measured. For the two samples represented by the left and right columns, values of GFAP+AF are 0.25 and 0.39, respectively.
