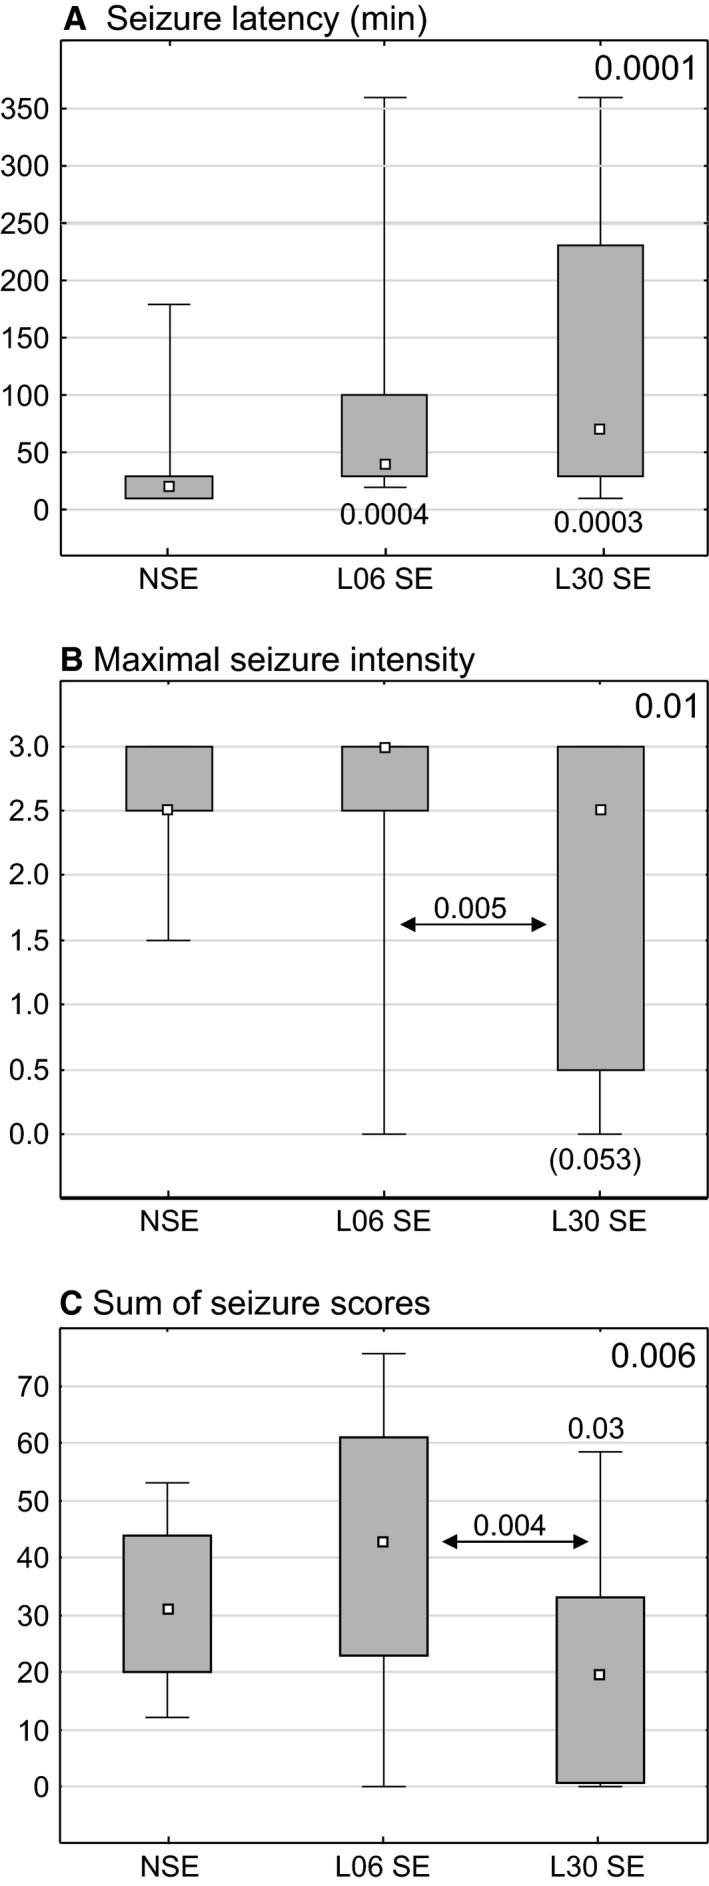
Figure 5.

Effects of LPS injections on the seizure latency (A) maximal seizure intensity (B) and sum of scores of maximal seizures for each of subsequent 10‐min periods during 6 h observation (C). Each graph shows the median (small black square), the 25–75% variability range (large box), and maximal and minimal values (whiskers). Decimal indexes over double‐headed arrows show statistical significance of differences between two animal groups (non‐parametric Mann–Whitney U‐test). Indexes in right top corners present levels of statistical significance of intergroup differences (non‐parametric Kruskal–Wallis test). An index in square brackets indicates statistical significance lower than 0.05. NSE, normal rats, L06 SE and L30 SE rats, injected with LPS alone on postnatal days 6 or 30, respectively, then subjected to pilocarpine‐induced seizures at the age of 2 months.
