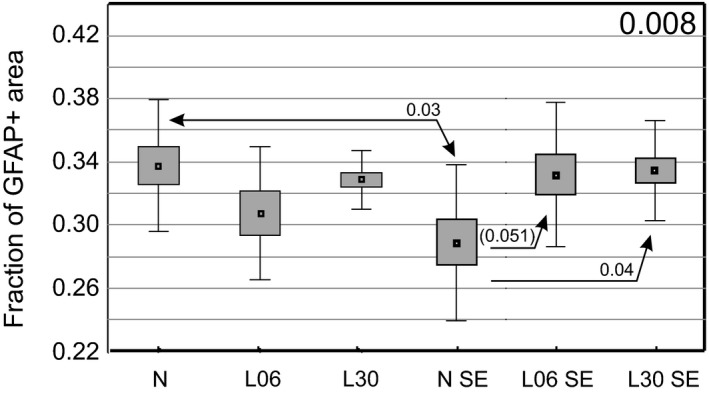
Figure 6.

Glial fibrillary acidic protein (GFAP)‐immunopositive area fraction in the hippocampal formation of rats treated on P06 or P30 with LPS alone (A) or additionally injected with pilocarpine at the age of 2 months (B). The diagrams show mean values (small squares), standard error of mean (large boxes), and standard deviation (whiskers). A decimal index at the upper right corner shows one‐way anova P‐value. Indexes located over double‐headed arrows show statistical significance of differences between two groups (Spjotvoll/Stoline post hoc test). A P‐value within the range 0.05–0.1 is enclosed in brackets. N, normal rats, L06 and L30, rats injected with LPS on postnatal days 6 or 30, respectively. SE added to each of the symbols indicates animal groups which additionally experienced seizures induced with pilocarpine at the age of 2 months.
