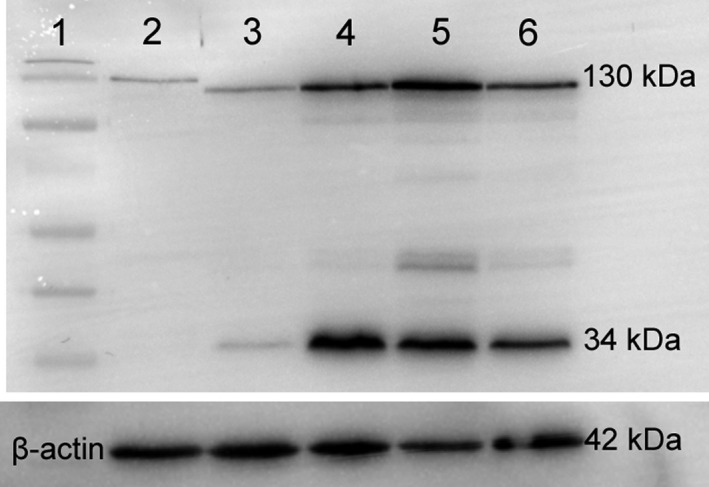
Figure 4.

Western blot of whole uterine tissue from the dunnart at early, mid‐ and late pregnancy as well as non‐pregnant dunnarts. Protein 20 μg loaded per well. Rat day 1 of pregnancy was loaded as a positive control. Bands for E‐cadherin are seen around 130 kDa in all loaded tissue and at 34 kDa in the tissue from pregnant dunnarts. Lane 1: normal molecular weight ladder (Page Ruler pre‐stained Protein Ladder). Lane 2: Rat day 1 of pregnancy. Lane 3: Non‐pregnant dunnart. Lane 4: Early pregnant dunnart. Lane 5: Mid‐stage pregnant dunnart. Lane 6: Late pregnant dunnart. β‐Actin (42 kDa) was used as a loading control.
