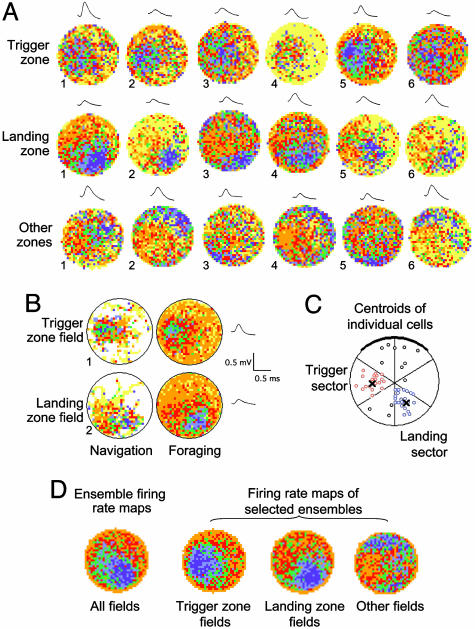
Fig. 3.
Electrophysiological results. (A) Firing rate maps of representative cells with fields in trigger zone (top row), landing zone (middle row), or other zones (bottom row) with average waveform shown for each cell (calibration bar common to all waveforms). Each firing rate map was built by using the data from the entire recording session. In all maps, yellow indicates no firing. Color codes (median firing rates). Trigger zone cells. No. 1: orange, 0.8; red, 1.5; green, 2.3; blue, 3.1; and purple, 4.6 AP per s; no. 2: 1.7, 2.9, 3.8, 4.8, and 6.6 AP per s; no. 3: 1.3, 2.3, 3.2, 4.6, and 7.1 AP per s; no. 4: 0.6, 1.1, 1.5, 2.1, and 2.9 AP per s; no. 5: 1.7, 3.8, 5.9, 7.8, and 11.1 AP per s; no. 6: 16.3, 19.8, 22.4, 25.0, and 28.8 AP per s; Landing zone cells. No. 1: 1.2, 2.3, 3.8, 6.2, and 11.9 AP per s; no. 2: 0.4, 0.7, 1.2, 2.2, and 4.6 AP per s; no. 3: 2.2, 3.4, 4.8, 6.1, and 8.0 AP per s; no. 4: 1.7, 2.9, 3.8, 4.8, and 6.6 AP per s; no. 5: 0.5, 0.9, 1.5, 2.4, and 4.5 AP per s; no. 6: 0.3, 0.7, 1.2, 2.1, and 4.2 AP per s; Other zone cells. No. 1: 2.4, 4.4, 6.8, 10.4, and 16.7 AP per s; no. 2: 0.6, 1.2, 2.0, 3.5, and 7.1 AP per s; no. 3: 0.7, 1.2, 1.8, 2.5, and 3.9 AP per s; no. 4: 1.1, 2.1, 3.2, 4.3, and 6.6 AP per s; no. 5: 1.3, 2.1, 2.8, 3.5, and 4.9 AP per s; no. 6: 1.2, 2.0, 3.1, 4.4, and 8.3 AP per s. (B) Firing rate maps of trigger zone cell no. 5 and landing zone cell no. 1 broken down to separate navigation episodes from foraging episodes. Navigation maps were based on 4-s data samples taken before (trigger zone field) or after (landing zone field) correct responses. Foraging maps were constructed from remaining data samples. Despite sampling time differences, navigation maps look similar to foraging maps for both the trigger and the landing zone cells, showing that firing was not restricted to a specific type of episode (color codes as in Fig. 3A). (C) Spatial distribution of field centroids in the cylinder in equally sized radial sectors (X marks the centers of trigger and landing zones). (D) Ensemble firing rate maps calculated from all fields (n = 53), and fields in trigger zone (n = 19), landing zone (n = 22) and other zones (n = 12). See also Fig. 4, which is published as supporting information on the PNAS web site.

