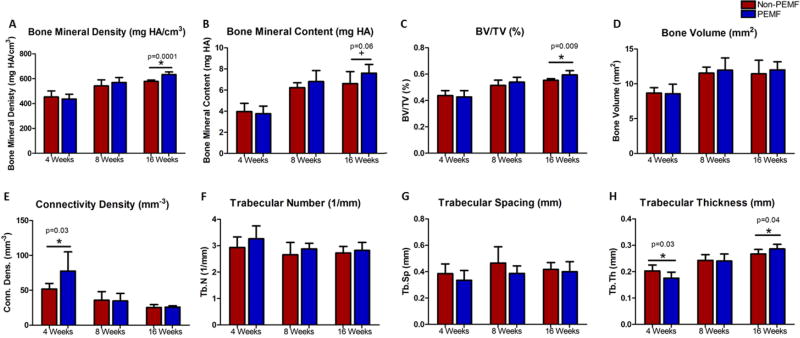
Figure 5.
µCT analysis. A) No differences were noted in bone mineral density at 4 and 8 weeks. At 16 weeks bone mineral density was significantly increased in the PEMF group compared to the non-PEMF group. B) No differences were noted in bone mineral content at 4 and 8 weeks. At 16 weeks bone mineral content trended toward significantly increased in the PEMF group compared to the non-PEMF group. C) No differences were noted in bone volume fraction at 4 and 8 weeks. At 16 weeks bone volume fraction was significantly increased in the PEMF group compared to the non-PEMF group. D) No differences were noted in bone volume at any time point. E) At 4 weeks connectivity density was significantly increased in the PEMF group compared to the non-PEMF group. No differences were noted at 8 and 16 weeks. F) No differences were noted in trabecular number at any time point. G) No differences were noted in trabecular spacing at any time point. H) At 4 weeks trabecular thickness was significantly decreased in the PEMF group compared to the non-PEMF group. No differences were noted at 8 weeks. At 16 weeks trabecular thickness was significantly increased in the PEMF group compared to the non-PEMF group. Data represented as mean ± SD.

