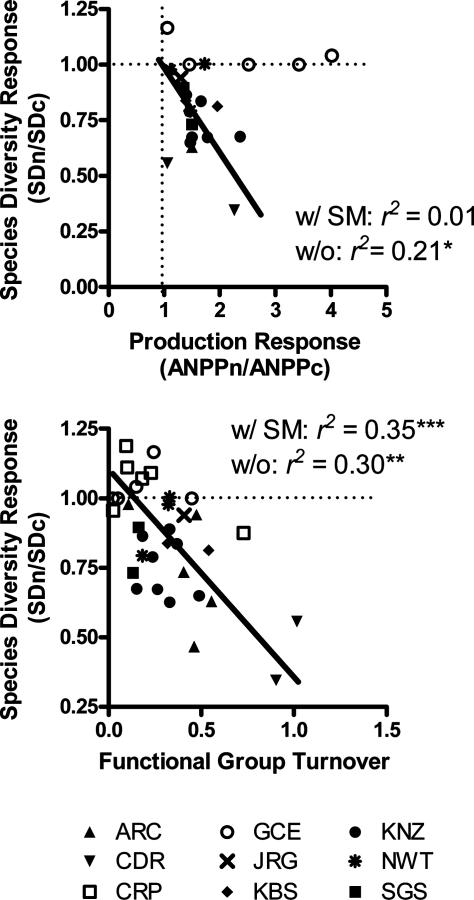
Fig. 2.
The decline in species diversity is related to the magnitude of production increase on plots fertilized with N (Upper) and the magnitude of functional-group turnover (Lower). Functional-group turnover is the mean of the responses of all functional groups to fertilization (see Materials and Methods) within an experiment. Each symbol represents one fertilization experiment. Regression coefficients are given when all experiments are included (w/SM) and when salt marshes are excluded (w/o). Open symbols indicate salt marshes. *, P < 0.05; **, P < 0.01; ***, P < 0.001; SDn and SDc, species density (no. of species per area) in fertilized and control plots, respectively; ANPPn and ANPPc, above-ground net primary production in fertilized and control plots, respectively. For site definitions, see the legend to Fig. 1.

