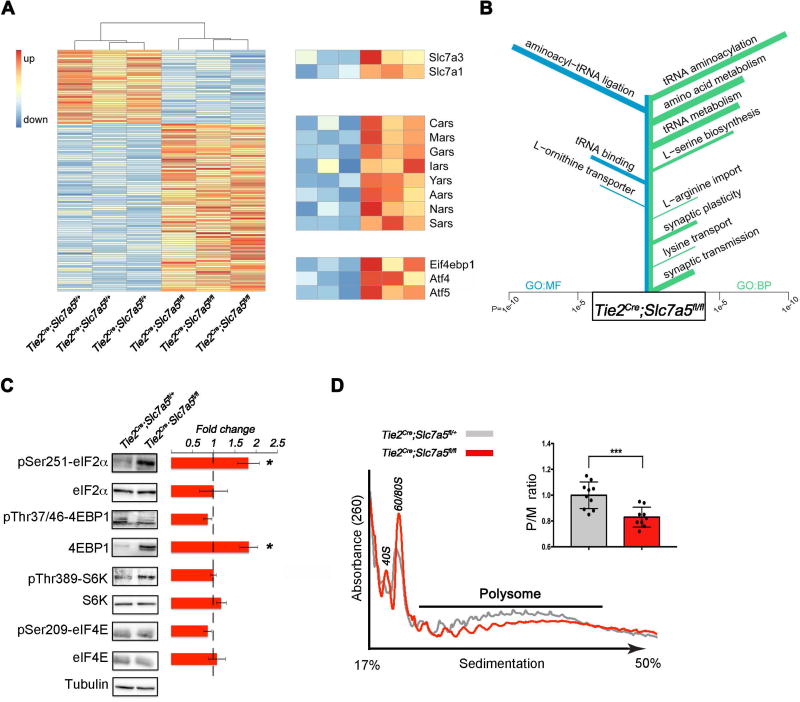
Figure 2. Activation of the amino acid response pathway in the brain of Slc7a5 mutant mice.
(A) RNA sequencing of adult brain in Tie2Cre;Slc7a5fl/+ and Tie2Cre;Slc7a5fl/fl mice revealed 131 differentially expressed genes (FDR-adjusted P-value ≤ 0.05). The heat map displays log transformed count data normalized to library size. Genes expressed at lower levels in Tie2Cre;Slc7a5fl/fl (40 genes) are displayed at the top and genes up-regulated in Tie2Cre;Slc7a5fl/fl (91 genes) are shown at the bottom. Zoomed rows on the right emphasize differentially expressed genes associated with amino acid import (GO:0089718), tRNA aminoacylation (GO:0006418) and amino acid response, respectively (n=3 mice/genotype).
(B) Results of GO Enrichment analysis on the set of 131 differentially expressed genes. Terms are sorted according to P-value with the most significantly enriched terms at the top: GO terms for molecular functions (GO:MF, left, blue); GO terms for biological processes (GO:BP, right, green). The length of each bar indicates the P-value while the width indicates the amount of genes in the set associated with the term.
(C) Western blot analysis from cortical lysates of Tie2Cre;Slc7a5fl/+ (control) and Tie2Cre;Slc7a5fl/fl mice, indicating that mutants exhibit increased phospho-eIF2α and total 4EBP1 protein levels but normal levels of total eIF2α, phospho-4EBP1, phospho-S6K, S6K, phospho-eIF4E and eIF4E. Tubulin was used as internal control. Representative blots (left) and fold change ratio (right); *P<0.05 (means ± SEM; n≥4 mice/genotype).
(D) Polysome profile from cortical lysates of control and Tie2Cre;Slc7a5fl/fl mice. Typical tracings indicating positions of 40S, 60S and 80S ribosome peaks and polysome (P)/monosome (M) ratio quantifications; ***P<0.001 (right inset: means ± SEM; n=10 control and n=9 mutant mice).

