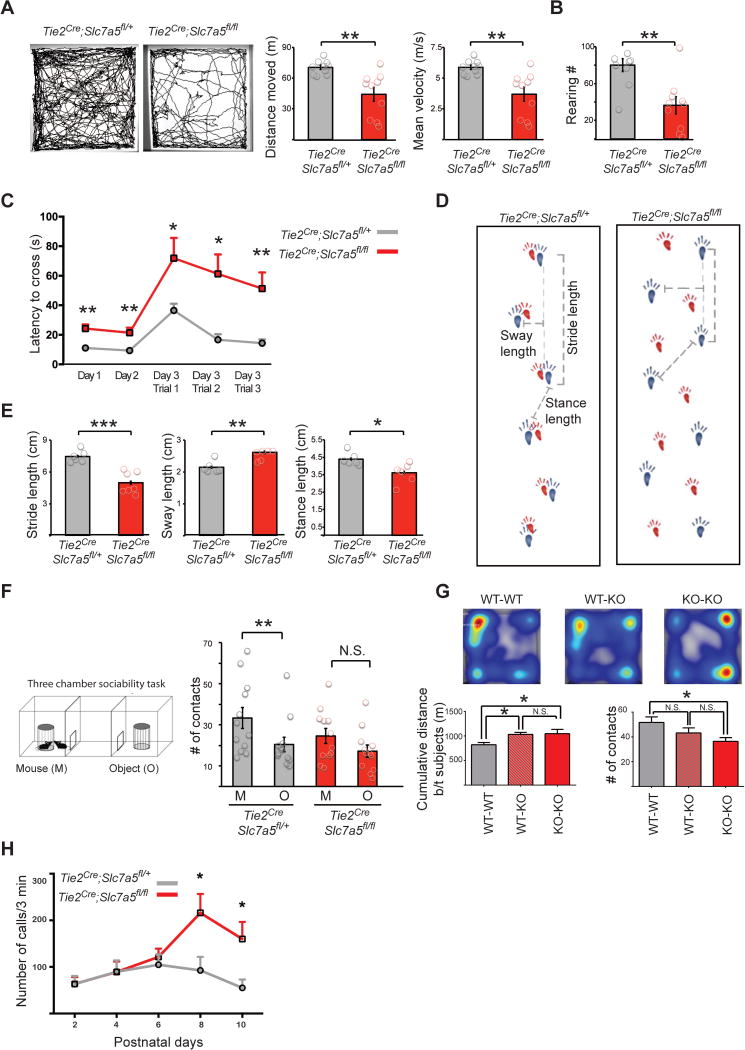
Figure 3. Neurobehavioral abnormalities in the Tie2Cre;Slc7a5fl/fl mice.
(A–D) Decreased exploratory behavior and locomotion abnormalities in the Tie2Cre;Slc7a5fl/fl mice. (A) Open field test. Representative trajectories (left) and quantification of the total distance moved (middle) and the velocity (right) indicating that Tie2Cre;Slc7a5fl/fl mice are outperformed by controls; **P<0.01 (means ± SEM; n=10 mice/genotype). (B) Comparison of the number of rearings pointing out deficiencies in the mutants; **P<0.01 (means ± SEM; n=10 mice/genotype) (C) Walking beam performance on training days (Day 1, Day 2) and on the three trials of the test day (Day 3), showing elevated latency to cross the beam in the mutants; *P<0.05, **P<0.01 (means ± SEM; n=7 mice/genotype). (D) Representative images of control (left) and Tie2Cre;Slc7a5fl/fl strides (right) in the gait test. Forepaw (red) and hindpaw (blue). (E) Altered gait of the Tie2Cre;Slc7a5fl/fl mice is evidenced by inter-genotype comparison of stride, sway and stance length quantifications; *P<0.05, **P<0.01, ***P<0.001 (means ± SEM; n=7 mice/genotype).
(F) Three chamber social interaction test (left) and quantifications (right) of the number of contacts with the caged mouse (M) or with the caged object (O) revealing abnormal social interaction pattern in the mutant mice (mutants show no preference for the M over the O, as opposed to controls); **P<0.01, N.S. not significant (means ± SEM; n=12 mice/genotype).
(G) Juvenile Tie2Cre;Slc7a5fl/fl mice display fewer reciprocal social interactions. Slc7a5 mutant mice tend to stay farther apart from their cage mate (heat-map and bottom left graph) and exhibit fewer nose-to-nose contacts (bottom right graph). WT= Slc7a5fl/+; KO= Tie2Cre;Slc7a5fl/fl. *P<0.05 (means ± SEM; n=8 mice/genotype).
(H) Isolation induced USV at various postnatal days show that Tie2Cre;Slc7a5fl/fl mice emit an increased number of calls starting at P8. *P<0.05 (means ± SEM; n=10 mice/genotype).
See also Figure S3.

