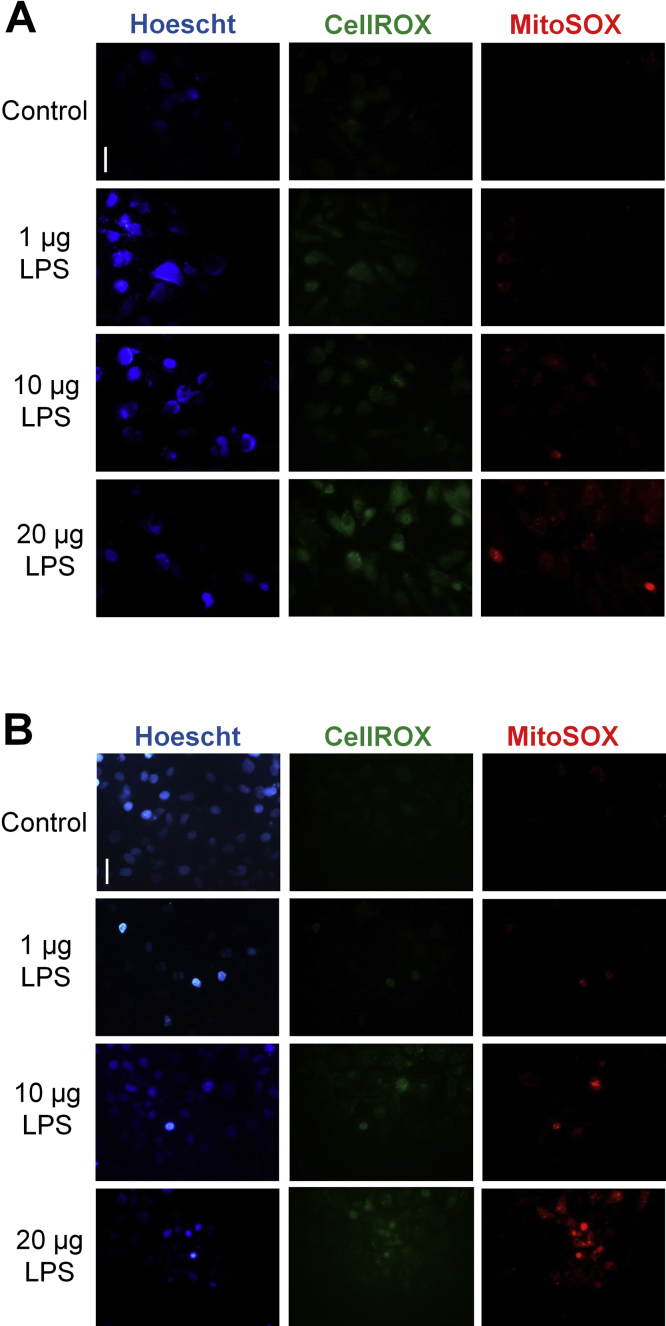
Fig. S1.
ROS generation in endothelial and proximal tubule cells during treatment with LPS. Levels of intracellular ROS in (A) HUVEC and (B) HK-2 cells 24 h after treatment with three different doses of LPS (1 µg/ml, 10 µg/ml, and 20 µg/ml). Intracellular ROS was detected by CellROX (green) and MitoSOX (red). Nuclei were labeled blue with Hoescht. Magnification = 400x. Line bar represents 25 µm. Slight corrections in brightness and contrast were made to images only for clarity.

