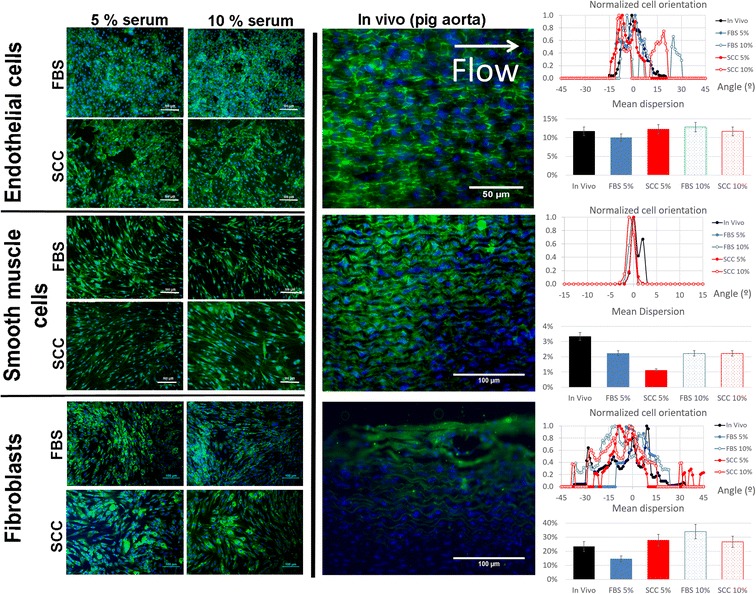
Fig. 3.

Analysis of cell structure by immunofluorescence. In terms of cell structure, CD31 was stained for endothelial cells, actin α smooth muscle for smooth muscle cells and collagen I for fibroblasts. Specific proteins are stained in green and nuclei in blue. Cellular orientation distribution was measured using Fiji’s plugin “Orientation J Distribution”. The Gaussian distribution of cellular orientations was centered on 0 and all values were divided by each case’s maximum value in order to get a normalized orientation value between 0 and 1. The mean dispersion percentage was calculated as the angle range that contained 80% of the orientations, divided by 180°
