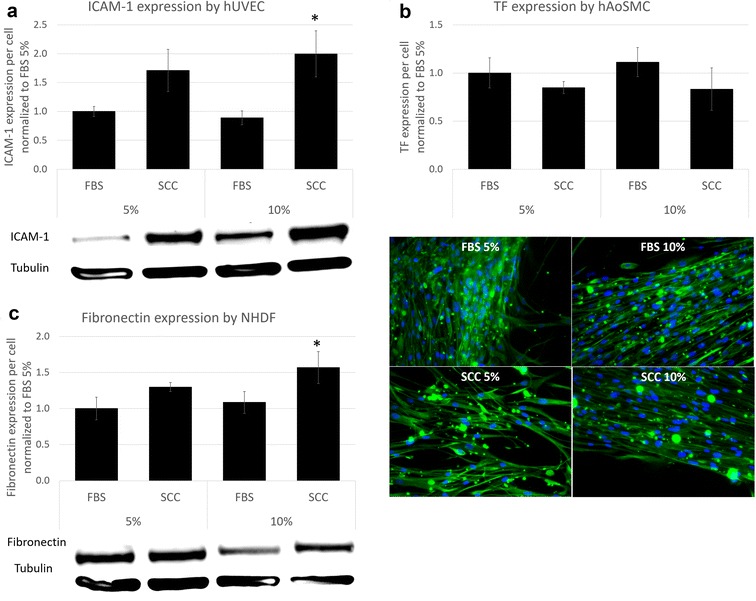
Fig. 4.

Cell activity analysis. Comparison of protein expression between cells supplemented with FBS and SCC at different levels. a ICAM-1 expression was analyzed by Western Blotting after the addition of TNF-α. b Tissue factor expression in injured human aortic smooth muscle cells was evaluated by immunofluorescence. The fluorescence intensity (green) was measured at the edge of the injury and divided by the number of cells. c Fibronectin expression in human normal dermal fibroblasts was analyzed by Western Blotting. All results are normalized to the value of FBS 5% and presented as mean ± standard error of mean as obtained of three independent values per group. Nonparametric Kruskal–Wallis test, followed by a Scheffé posthoc analysis was performed, and differences were considered significant if p < 0.05
