
FIGURE 2. Myocyte contractile function and phosphorylation 2 days after gene transfer of cTnI-FLAG, -SDTD, and –S4D compared to non-treated controls.
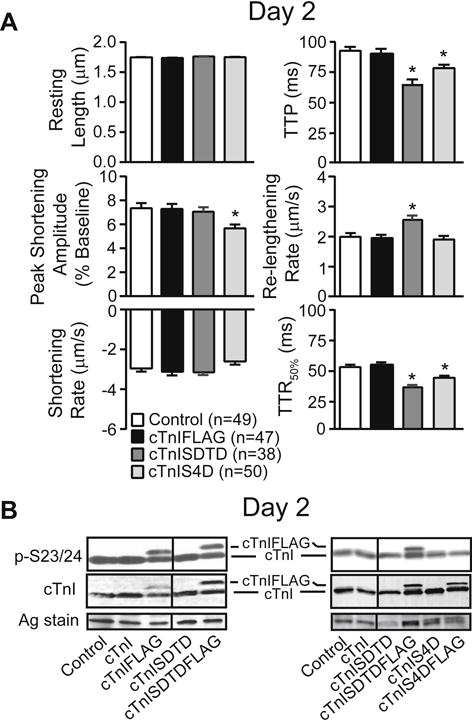
A. Analysis of signal averaged resting sarcomere length (SL, μm), peak shortening amplitude (expressed as a percent of resting length), shortening and re-lengthening rates (μm/s), along with the time to peak (TTP), and time to 50% re-lengthening (TTR50%) in 38–50 myocytes per group (6–8 hearts/group), as described earlier (24). Results were compared to control values using 1-way ANOVA and post-hoc Newman-Keuls tests, with statistical significance set at p<0.05 (*). B. Representative Westerns show results for cTnI p-S23/24 and total cTnI in control, cTnI, cTnISDTD ± FLAG, and cTnIS4D ± FLAG expressing myocytes 2 days after gene transfer. The response for cTnISDTDFLAG is compared to cTnIFLAG in the left panel, and the responses for cTnISDTDFLAG and cTnIS4DFLAG are shown in the right panel. The relative p-S23/24 levels remain similar to control values for myocytes expressing each of the phospho-mimetics 2 days after gene transfer. A silver (Ag) stained portion of each gel also is shown to indicate protein loading in each lane. Vertical black lines in each blot indicate a separation between cTnI or cTnI-FLAG and -SDTD on the same blot.