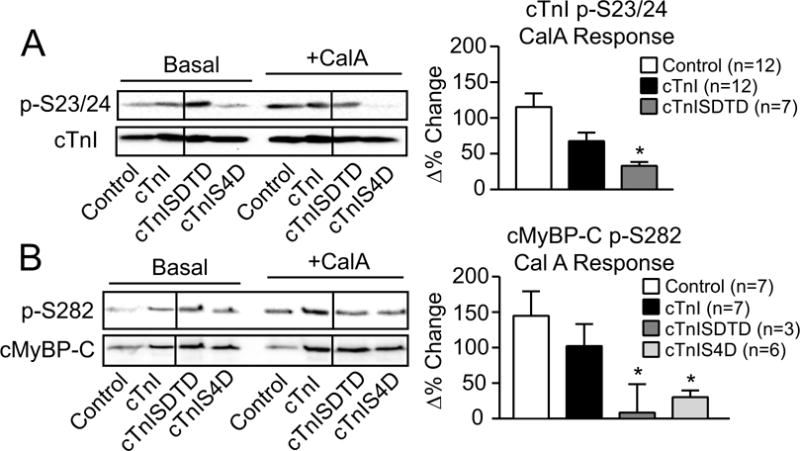
FIGURE 5. Secondary myofilament phosphorylation in the presence and absence of phosphatase inhibition by calyculin A (calA).

Representative Western (left panel) and quantitative (right panel) analyses of cTnI p-S23/24 (A) and cMyBP-C p-S282 (B) in the absence and presence of the phosphatase inhibitor calA (10 nM) and expressed relative to total cTnI and cMyBP-C, respectively. The ratio of phosphorylated/total protein is normalized to control values (set to 1.0) in the absence of calyculin A (CalA) for the quantitative analysis. Then, control responses to calA (Δ% change) on day 4 are compared to responses in cTnI-, cTnISDTD- and cTnIS4D-expressing myocytes, with the Δ% response shown in each right panel graph. The p-S23/24 and p-S282 levels after calA treatment are not different among groups. The Δ% change in the p-S23/24/cTnI and the p-S282/cMyBP-C ratios were analyzed by ANOVA (see Methods) with statistical significance set at p<0.05 (*). Note the absence of p-S23/24 detection in the cTnIS4D response (panel A). Any p-S23/24 detection in cTnIS4D myocytes is due to residual endogenous cTnI expression and not explained by calA treatment.
