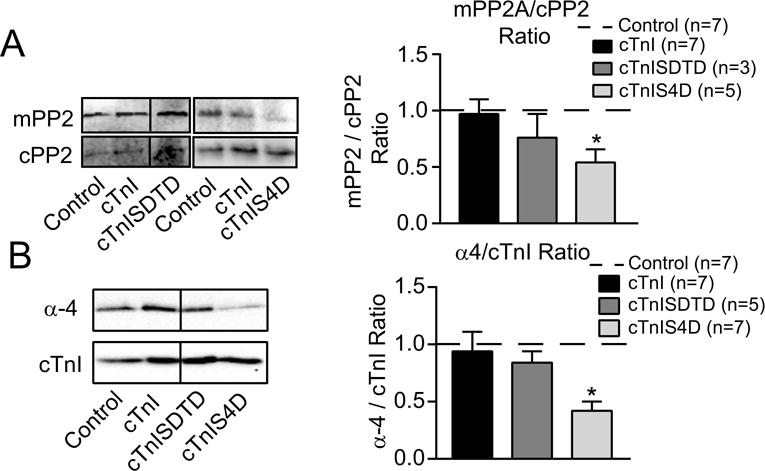
FIGURE 6. Analysis of phosphatase activity and stability in myocytes expressing cTnISDTD and cTnIS4D compared to controls and cTnI.

A. Western analysis of methylated protein phosphatase 2A (mPP2; upper left panel) and PP2A catalytic subunit (cPP2; lower left panel) along with the quantitative analysis of the mPP2/cPP2 ratio (right panel) for cTnISDTD and cTnIS4D. Blots were initially probed for mPP2, stripped and re-probed for cPP2, and then stained with Sypro stain. Then, the cPP2/Sypro band ratios were normalized to control values on the same blot (set to 1.0, n=7) and these ratios were not different between groups (cPP2/Sypro ratio: cTnI 1.11+0.15, n = 7; cTnISDTD 1.30+0.86, n = 3; cTnIS4D 1.15+0.23, n = 5). The ratio of mPP2/normalized cPP2 ratio was determined for the quantitative analysis shown in the right panel. B. Representative Western analysis of alpha-4 (a-4; left upper panel) relative to cTnI (lower left panel), plus the quantitative analysis of a-4/cTnI ratio (right panel) in day 4 myocytes. Each set of results was statistically analyzed by ANOVA (see Methods) with significance set at p<0.05 (*).
