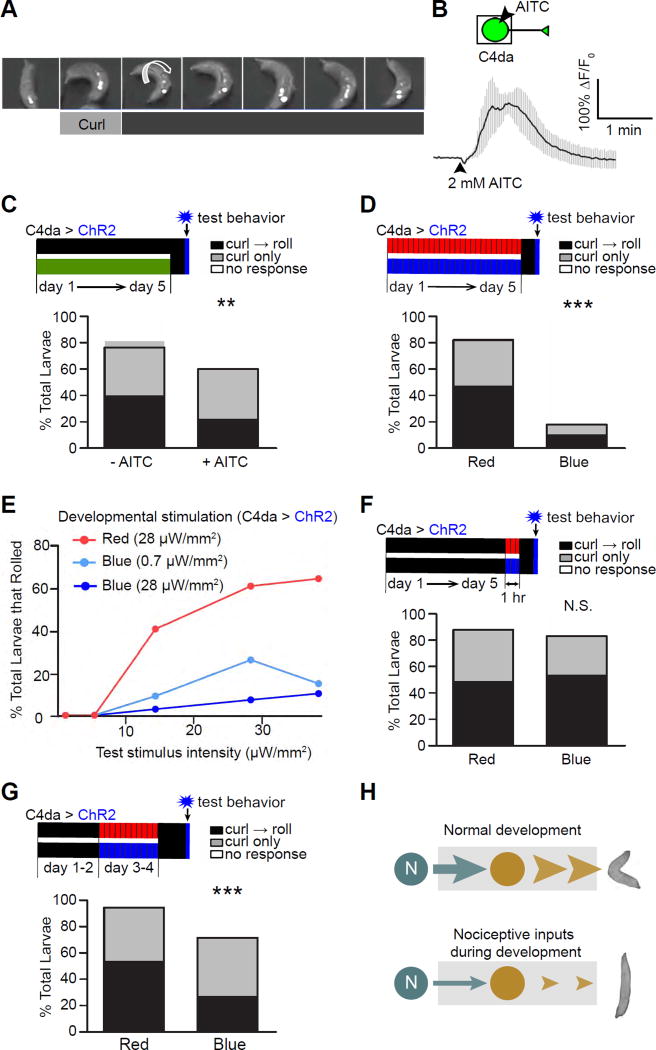
Figure 1. Activation of larval nociceptors during development suppresses nociceptive behavior in mature larvae.
(A) A montage showing nociceptive behavior responses, including curling and rolling, in a 3rd instar larva. ChR2 was expressed specifically in C4da nociceptors and activated by illumination with blue light. Small arrows point to the openings of dorsal trachea to indicate the larva’s body position, and the large arrow indicates the direction of rolling.
(B) AITC activates C4da neurons. The boxed area in the schematic indicates the part of the cell imaged for calcium signals. The trace shows the average of responses. n = 3. Error bars are SEM in all figures in this paper.
(C) Larvae raised on AITC exhibit reduced nociceptive behavior. Top panel: a diagram showing the experimental scheme. The developmental timeline of larvae is shown as days 1–5, with day 1 being the first day of development after egg laying (AEL) and day 5 being the time when the larvae are at the late 3rd instar stage. Control larvae were reared on regular food throughout development (black bar), whereas experimental larvae were reared on food containing 2.5 mM AITC (green bar). The vertical blue bar indicates the blue light used in optogenetic stimulation for behavioral tests on day 5, and the vertical black bar indicates the 1 hr of darkness prior to the tests. Throughout the paper, the following color coding is used: green for AITC; black for darkness or no AITC; red for red light (617 nm); blue for blue light (470 nm); and gray for ATP. Moreover, the expression of proteins for stimulating nociceptors (i.e., ChR2, CsChrimson, and P2X2) is indicated by “C4da > proteins” above the timeline bars. n = 75 larvae per group. Bars represent the percentage of total larvae that performed rolling following curling (“curl → roll”), curling only, and no response. Note that every roll starts with curling.
(D) Optogenetic stimulation of nociceptors during larval development leads to a dramatic suppression of nociceptive behavior. n = 45 larvae per group.
(E) Developmental stimulation suppresses the maximal response of nociceptive behavior in mature larvae. Larvae that expressed ChR2 in C4da neurons were reared under pulses of red (28 µW/mm2) or blue light (0.7 or 28 µW/mm2) during development. Rolling responses of late 3rd-instar larvae were tested with 5 different intensities of blue light (0.7, 5, 14, 28, and 38 µW/mm2). n = 115, 88, and 69 larvae for red, 0.7 µW/mm2 blue, and 28 µW/mm2 blue, respectively.
(F) Larvae that received acute stimulation (1 hr) of nociceptors do not exhibit suppression of nociceptive behavior. n = 60 larvae per group.
(G) Stimulating nociceptors on days 3–4 AEL (early 3rd instar larval stage) suppressed nociceptive behavior in mature larvae tested on day 5 (i.e., 24 hrs after pulse stimulation). n =100 larvae for each group.
(H) A set of diagrams that summarize the results in this figure. Stimulation of nociceptors during development leads to suppression of nociceptive behavior in mature larvae.
(See also Figures S1 and S2)

