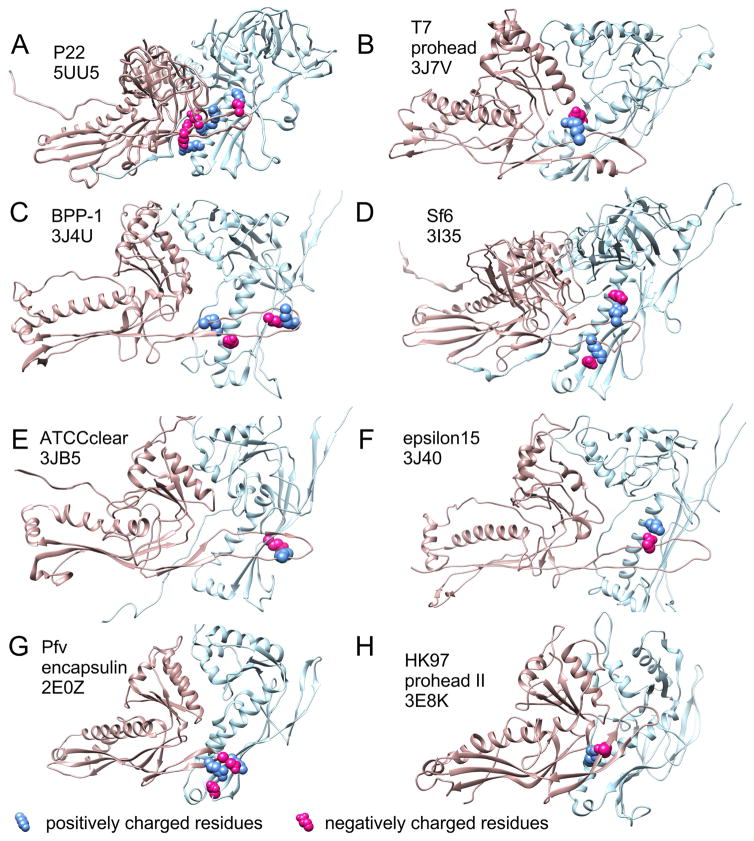
Figure 9. Capsid protein PDB models with E-loops overlapping the adjacent subunits and potential analogs of the E153-R210 interaction in HK97.
The PDB files listed in Supplemental Table 1 were opened in Chimera [50] and (in those with side chains) searched for potential ionic interactions between the E-loop and the adjacent subunit. For those with such interactions, figure panels showing two subunits from the model’s hexon were prepared with residues involved in potential side chain interactions shown in space-filling mode with positively charged residues in blue and negatively charged residues in red. HK97 is shown in panel H for comparison. The source name and the PDB ID’s are indicated in the figure panels. The chains used for each panel are as follows: A, (F and A), B, (D and C), C, (B and A), D, (C and B), E, (F and A), F, (C and D), G, (A and B), H, (F and A).

