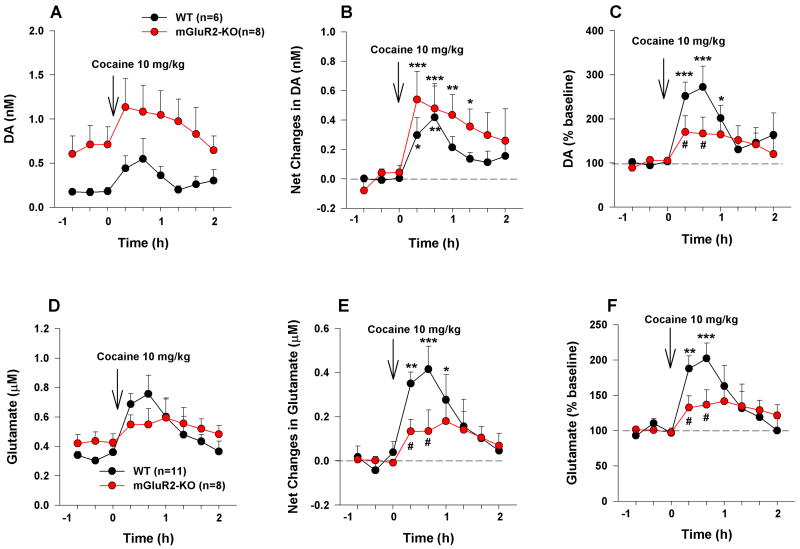
Figure 6.
Cocaine-induced changes in extracellular DA and glutamate in WT and mGluR2-KO rats measured during reinstatement testing. (A, B, and C) Cocaine-induced changes in extracellular DA, expressed as DA concentrations (nM) (A), net changes (postcocaine DA – precocaine DA, nM) (B), or percent of precocaine baseline (C). (D, E, and F) Cocaine-induced changes in extracellular glutamate, expressed as glutamate concentrations (µM) (D), net changes (postcocaine glutamate – precocaine glutamate, µM) (E), or percent of precocaine baseline (F). The data are represented as mean ± SEM. *p<0.05; **p<0.01; ***p<0.001 compared with precocaine baseline. #p<0.05 compared with WT rats. Also see Figures S3–S4.

