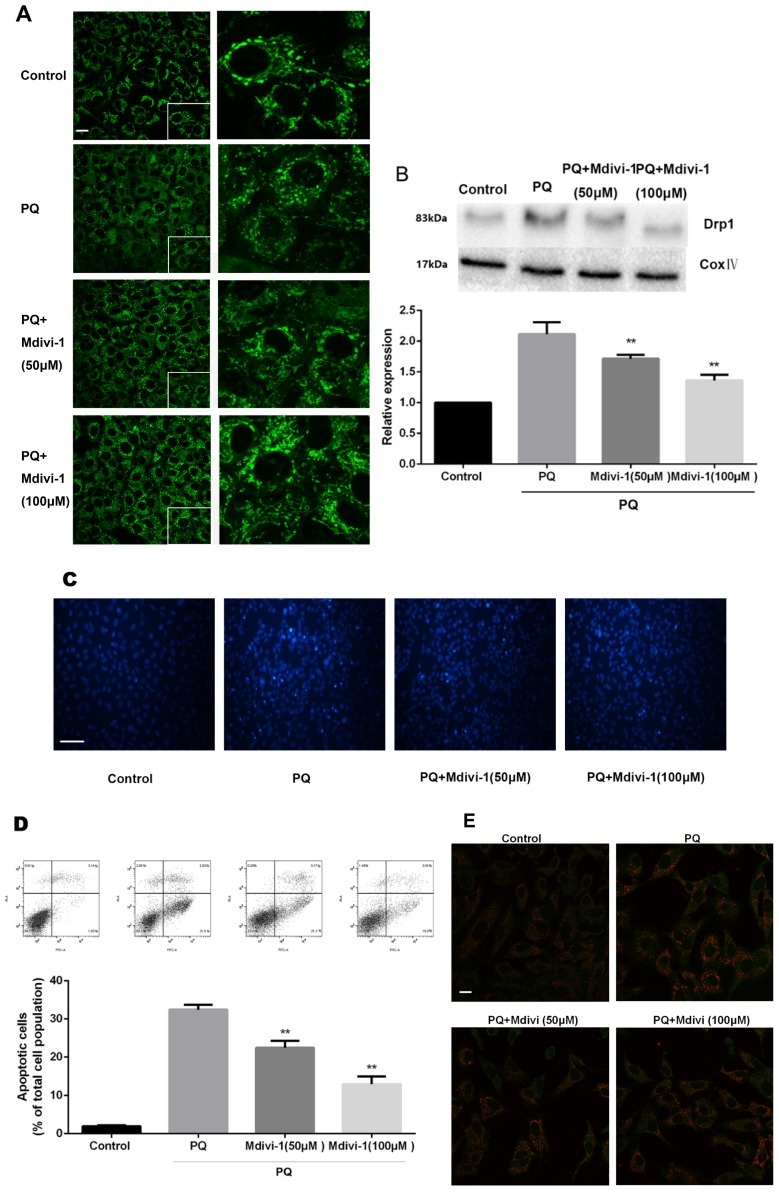
Figure 4.
The mitochondrial morphology, apoptosis and the release of Cyt-c of mouse AT-II cells after co-incubated with PQ and Mdivi-1. Mouse AT-II cells were treated with 600 μM PQ and Mdivi-1 (50 and 100 μM) for 24 h. (A) Cells were expressing mito-GREEN and were observed under a fluorescence microscope. (Images in the right row are magnified views of the boxed areas in left row. Scale bar: 20 μm) (B) The mitochondrial location of Drp1 was determined by using western blot. The Cox IV was used as the loading control. The values are expressed as the means ± SD from 4 independent experiments. ** P < 0.01, vs PQ group. (C) Cells were stained with Hoechst 33342 and observed by fluorescence microscope. (Scale bar: 100 μm) (D) The apoptosis of the cells was detected by using a FACSalibur flow cytometer. The values are expressed as the means ± SD from 5 independent experiments. ** P < 0.01, vs PQ-treated group. (E) Cyt-c was visualized by staining with anti-Cyt-c antibody, followed by secondary antibody. Cells were observed under a fluorescence microscope. (Scale bar: 20 μm).

