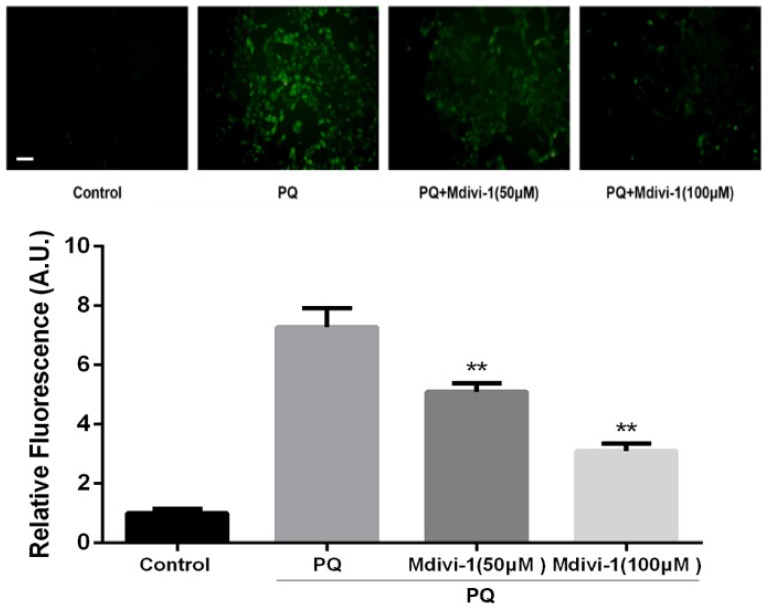
Figure 5.
ROS production in mouse AT-II cells after co-incubated with PQ and Mdivi-1. Mouse AT-II cells were treated with 600 μM PQ and Mdivi-1 (50 and 100 μM) for 24 h. Then cells were stained with DCFH-DA and observed by a fluorescence microscope. The values are expressed as the means ± SD from 6 independent experiments. ** P < 0.01, vs PQ-treated group. (Scale bar: 50 μm)

