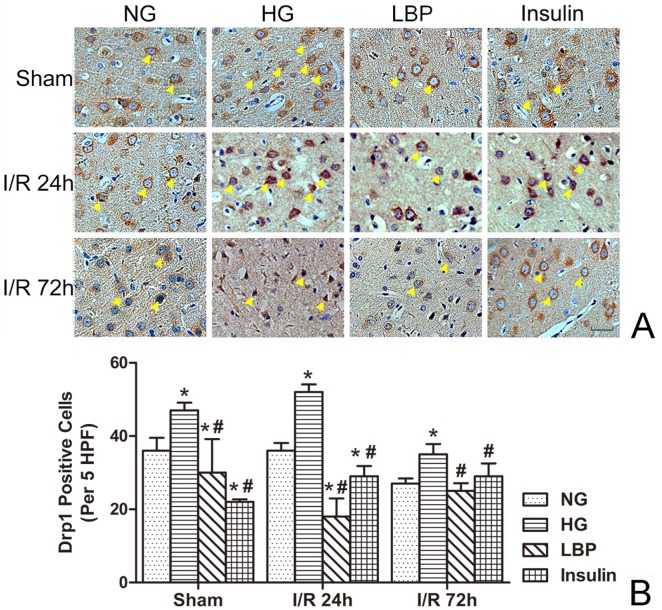
Figure 6.
Expression of Drp1 in NG, HG, LBP and Insulin groups after 24 and 72 hours of reperfusion. A, Representative pictograghs showing immunohistochemistry staining of Opa1. Opa1 positively stained cells appear brown against a blue counterstain (hematoxylin). Yellow arrow heads indicate positively stained cells. Bar = 50 μm. B, Quantitative summary showing the number of Drp1-positive cells; *P<0.05, vs. NG group; #P<0.05, vs. HG group, respectively.

