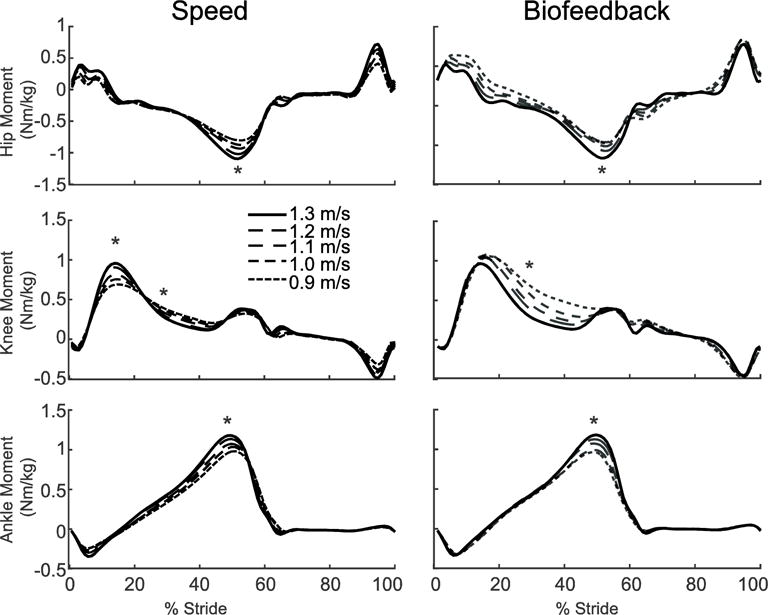
Figure 4.

Group average lower extremity joint moments as modified by reductions in speed (left) and FP (right). Positive values indicate external extension moments. Gray dashed lines represent biofeedback trials at 1.3 m/s with FP target values prescribed from the corresponding walking speeds. Asterisks (*) represent significant main effects of speed or reduced FP.
