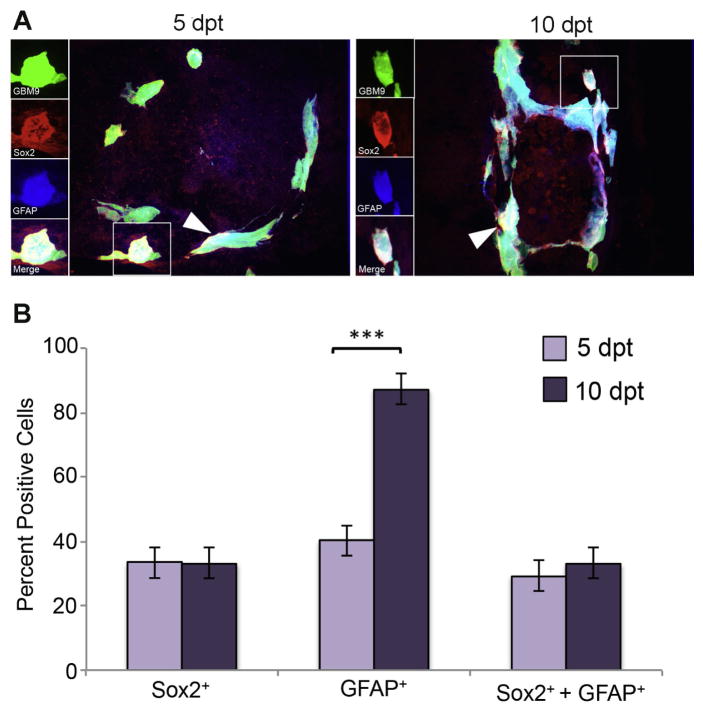
Figure 4. Putative GBM9 cancer stem cells express both Sox2 and GFAP.
(A) 20 μm sections of zebrafish with GBM9 tumors (green) were analyzed at 5 and 10 dpt. Sections were stained with anti-Sox2 (red) and anti-GFAP (blue). Triple labeled cells are white (white arrow heads). The inset to the left of the image shows each of the channels separated. (B) Antibody labeled sections were counted for the number of cells expressing GFAP, Sox2 or both GFAP and Sox2. Light purple bars represent 5 dpt and dark purple bars represent 10 dpt (mean ± SD). n = 5 animals per group. ***p<0.0001.

