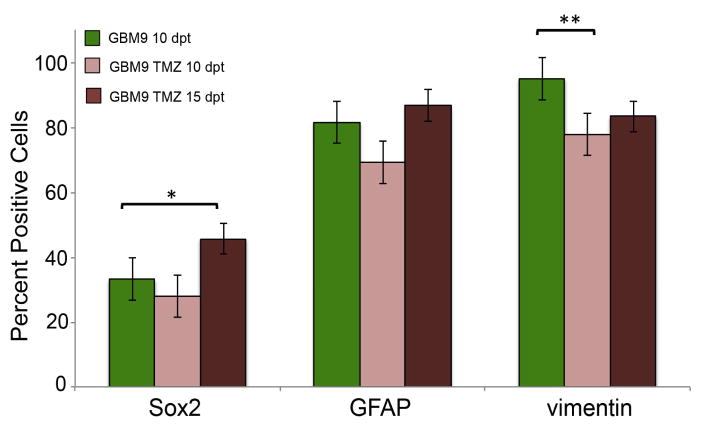
Figure 7. Quantification of Sox2, GFAP and vimentin immunohistochemistry pre and post-TMZ treatment.
(A) Percentage positive cells for Sox2, GFAP and vimentin in GBM9 transplanted zebrafish untreated with TMZ at 10 dpt (green bars), GBM9 transplanted zebrafish treated with TMZ from 5 to 10 dpt at 10 dpt (light red bars) and GBM9 transplanted zebrafish treated with TMZ at 15 dpt (dark red bars) (mean ± SD). n = 5 animals per group. *p<0.05, **p<0.001

