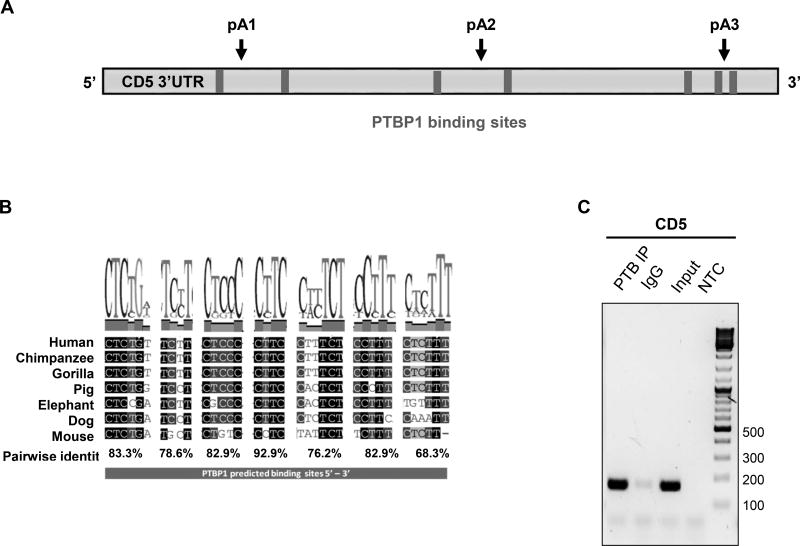
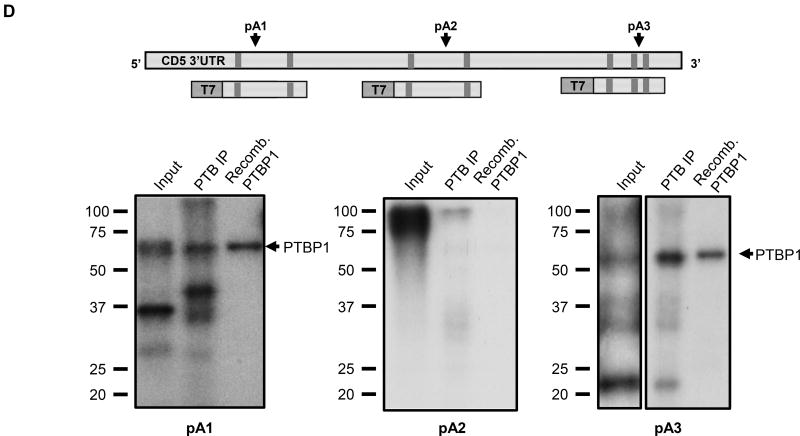
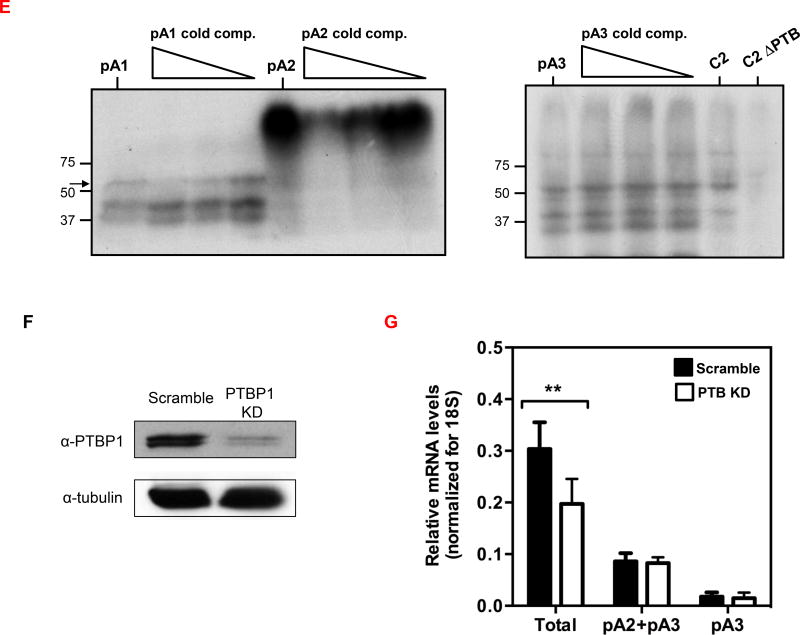
Figure 4. PTBP1 increases CD5 pA1 mRNA levels.
(A) PTBP1 putative binding sites were predicted in the CD5 3′ UTR sequence using SFmap predictor. Sequences with scores higher than 0.8 (0–1 range) are indicated. Arrows represent the PAS location on CD5 3′ UTR. (B) Conservation analysis of the seven putative PTBP1 binding sites performed by alignment of the CD5 3′ UTR sequences of seven representative mammalian species using the Geneious v4.8 software. Pairwise percentage identities are indicated. (C) RNA immunoprecipitation using an anti-PTBP1 antibody and analyzed by RT-PCR. Primers were designed in the proximity of CD5 pA1. (D) Top: schematic representation of the three DNA fragments used in the RNA in vitro transcription with the T7 promoter. Bottom: UV-crosslinking and immunoprecipitation assays using Jurkat nuclear extracts. First lane of each gel: input of UV-crosslinking samples; second lane: immunoprecipitation with anti-PTBP1 antibody after UV crosslinking; third lane: UV-crosslinking assay using recombinant PTBP1. (E) UV-crosslinking competition assays. Each radiolabeled pA1, pA2 and pA3 was incubated with 10, 5 and 1-fold molar excess of unlabeled pA1, pA2 and pA3 competitor transcript (Cold comp.). C2 and C2ΔPTB were used as positive and negative controls for PTB binding, respectively. (C-E) Data shown are representative of 2 independent experiments. (F) Knock-down of PTBP1 in Jurkat cells assessed by western blot using a PTBP1 specific antibody. An anti-α-tubulin antibody was used as loading control. (G) Relative expression of CD5 APA mRNA isoforms after PTBP1 knock-down (PTB KD). A Scramble sequence was used as control. Data are shown as mean + SD and are pooled from 4 independent experiments. ** p<.01; two-way ANOVA with Turkey’s multiple comparison test.


