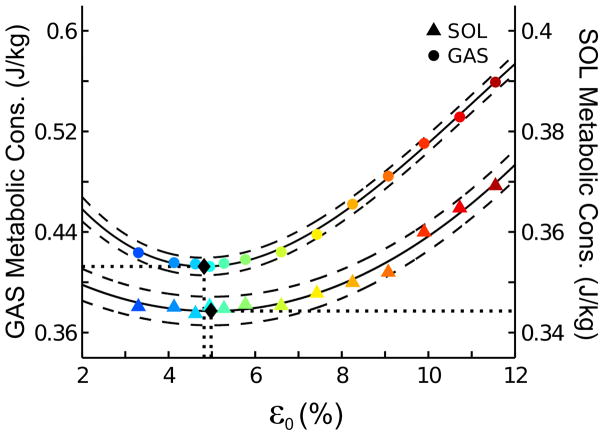
Figure 5.
Alterations in simulated gastrocnemius (GAS) and soleus (SOL) metabolic energy consumption per unit body mass as a function of altered tendon peak strain at maximal isometric force (ε0). Solid and dashed lines are the polynomial fit to simulated data and respective 95% confidence intervals. Black diamonds indicate tendon strain at optimal metabolic energy consumption.

